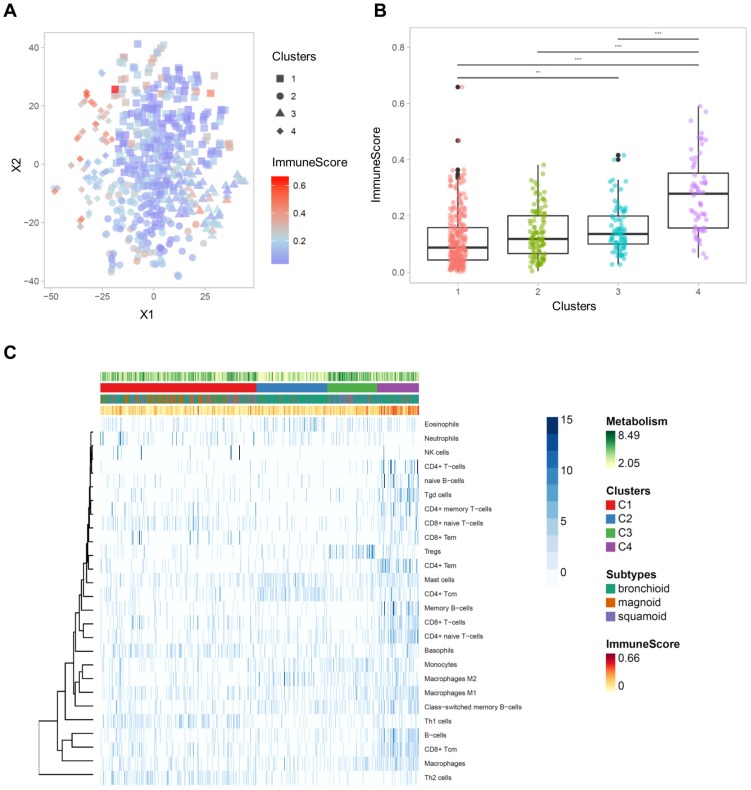
Figure 3.
The comprehensive illustration showing the relationship between immune landscape and tumor metabolism index. (A) A two-dimensional TME landscape map with ImmuneScore is shown. Each point, either being square (cluster 1), circle (cluster 2), triangle (cluster 3), or diamond (cluster 4), is a sample, with the color scale indicating the ImmuneScore. (B) The ImmuneScores were significantly different between the clusters, and the cluster 4 showed significantly higher ImmuneScores than the other clusters. (C) A heatmap depicting the immune cell types enrichment scores of all samples. The heatmap represents cell types enrichment scores of each immune cell type. TMI, clusters based on immune cellular heterogeneity, lung adenocarcinoma subtypes, and ImmuneScore are shown for each sample (above the heatmap).

