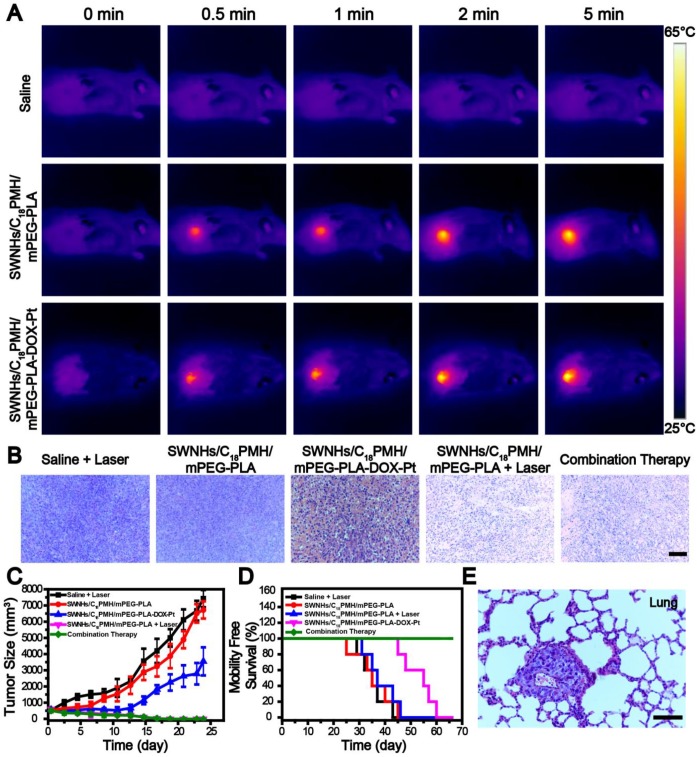
Figure 8.
Chemo-photothermal combination therapy in tumors. A) Infrared thermographic maps of tumors exposed to an 808 nm laser at 1 W/cm2 24 h after tumor-bearing mice were intravenously injected with PBS, SWNHs/C18PMH/mPEG-PLA, or SWNHs/C18PMH/mPEG-PLA-DOX-Pt (10 mg SWNHs/kg body weight). B) H&E staining of tumor tissues immediately after laser treatment. Scale bar: 100 µm. C) Relative tumor size and D) survival of mice in different treatment groups. E) H&E staining of lung tissues before treatment. Mice had already developed lung metastases prior to treatment. Scale bar is 100 µm.

