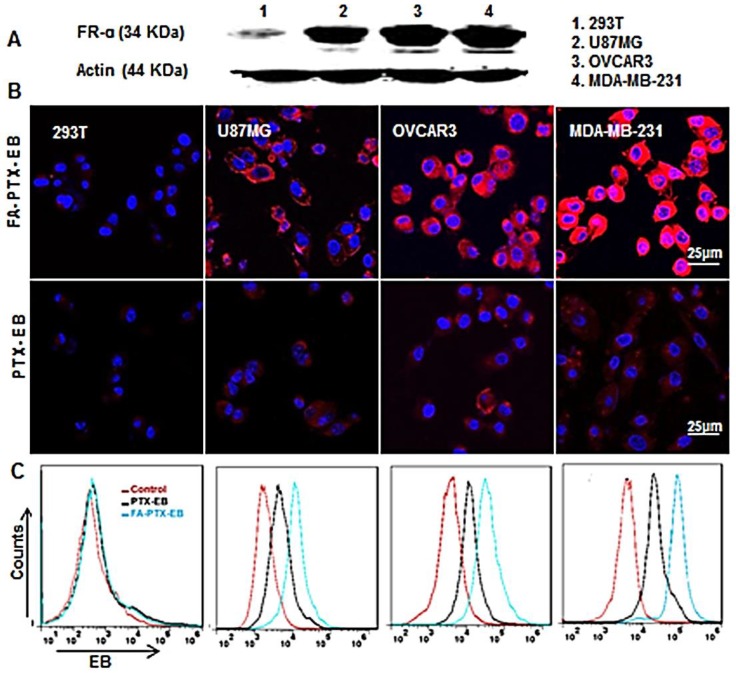
Figure 2.
Cellular uptake of FA-PTX-EB in a series of tumor cells with different expression levels of FR-α. (A) Western blot results verify the different expression levels of FR-α on tumor cells and normal cell lines. (B) Confocal microscopy images showing the intracellular uptake ability of FA-PTX-EB and PTX-EB prodrugs in 293T, U87MG, OVCAR3, and MDA-MB-231 cells. The nucleus is stained by DAPI, and the red corresponds with EB fluorescence from EB-conjugated compounds. (C) Flow cytometric analysis of FA-PTX-EB and PTX-EB prodrug in 293T, U87MG, OVCAR3, and MDA-MB-231 cells.

