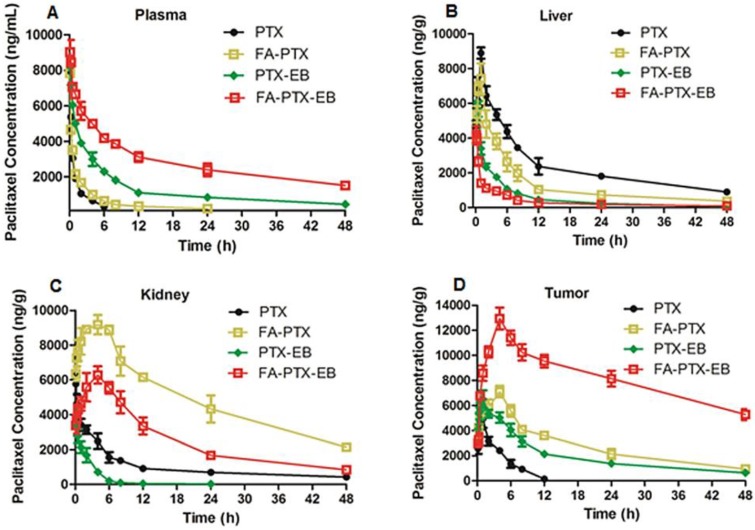
Figure 5.
In vivo pharmacokinetic studies. (A) Mean concentration-time profile of PTX in plasma following i.v. administration of a single dose of 6 mg/kg of PTX, FA-PTX, PTX-EB, or FA-PTX-EB in mice. Time courses of PTX levels in tissues of MDA-MB-231 inoculated mice following i.v. administration of a 6 mg/kg dose of PTX or equivalent formulated PTX. (B) Liver. (C) Kidneys. (D) Tumor. Data are shown as the mean concentration ± S.D. (n = 5/group).

