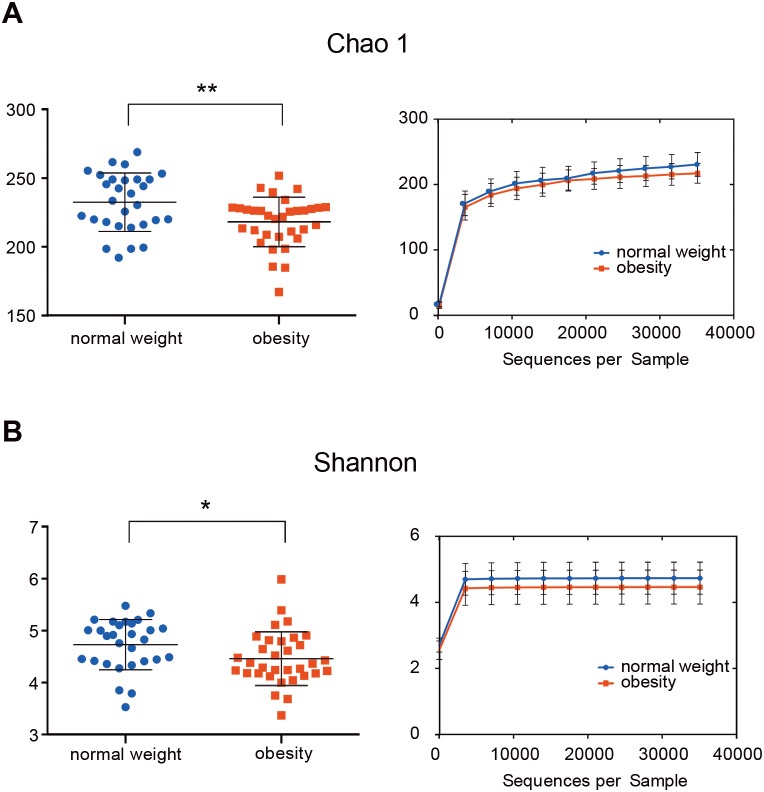
Figure 1. The alpha diversity of people with obesity and controls.
The alpha diversity of people with obesity and normal weight controls. A two-tailed Mann–Whitney U test was used; ∗P < 0.05, ∗∗P < 0.01. Normal weight subjects were significantly different by the Chao 1 (A) and Shannon index (B) measures of diversity.

