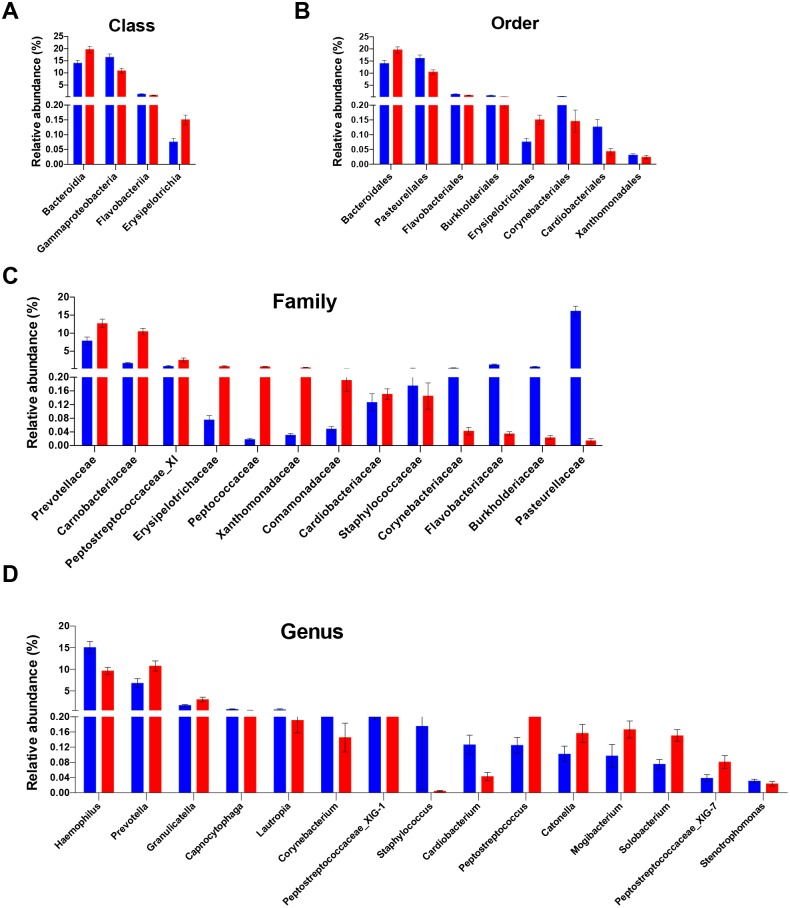
Figure 2. Differentially abundant taxa between people with obesity and normal weight controls.
The taxa differed in terms of relative abundance at the class level (A), the order level (B), the family level (C), and the genus level (D). (Kurskal-Wallis test, FDR -adjusted P < 0.05). The bars indicate mean ± SEM. Red for obesity group, blue for normal weight group.

