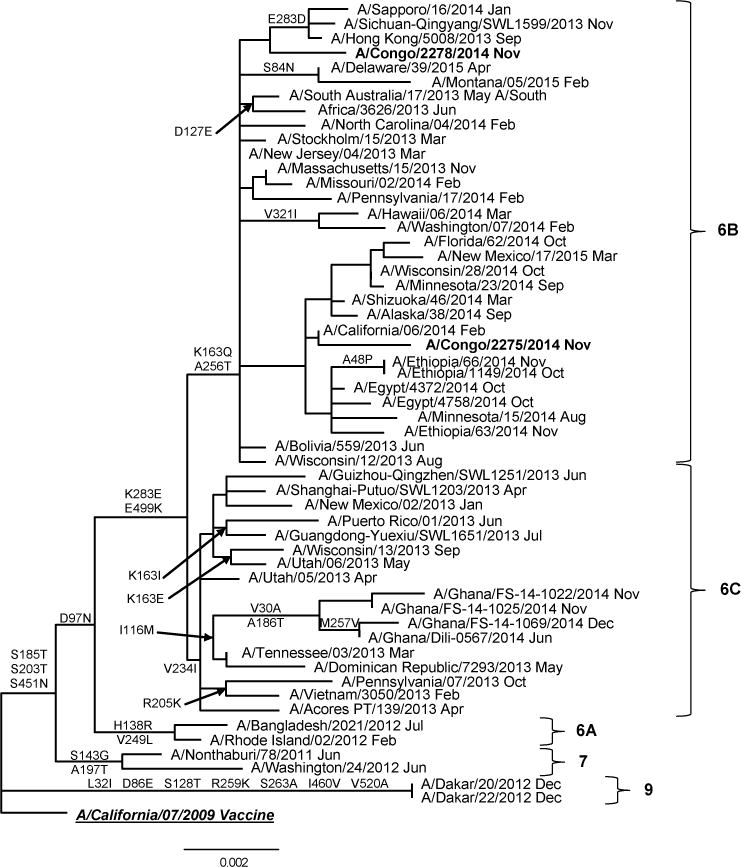
Figure 3.

Representative hemagglutinin ML phylogenetic tree of A(H1N1)pdm09 viruses collected since 2009. The A/California/07/2009 (underlined, bold) was used as reference in TREESUB to estimate ML phylogenetic trees via RAxML and PAML, and for automated annotation of amino acid substitutions in the nexus format. The consensus HA tree and the transcribed amino acid substitutions were visualized in FigTree. The scale bar represents the average number of nucleotide substitutions per site. Genetic groups 6, 7 and 9 are depicted in the tree. DRCongo isolates (bold) clustered with viruses from genetic subgroup 6B.
