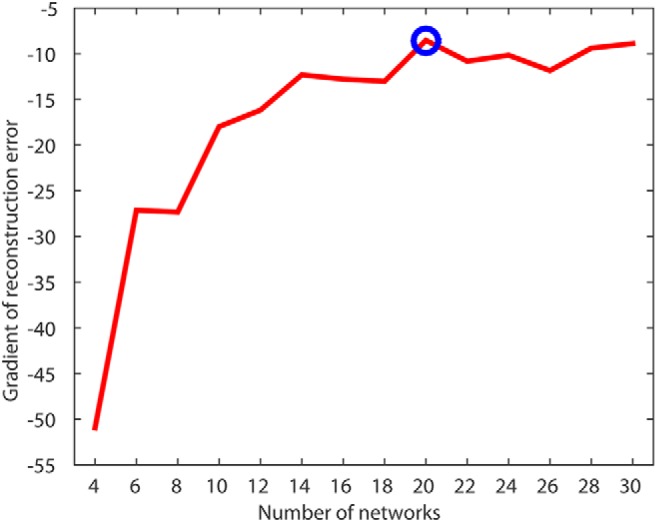
Figure 2.

NMF reconstruction error identifies 20 cortical networks as the optimal resolution for CT data. Plot of reconstruction error gradient for NMF at multiple resolutions; the gradient is the difference in reconstruction error as the NMF solution increases by two networks. Blue circle indicates selected NMF solution of 20 networks.
