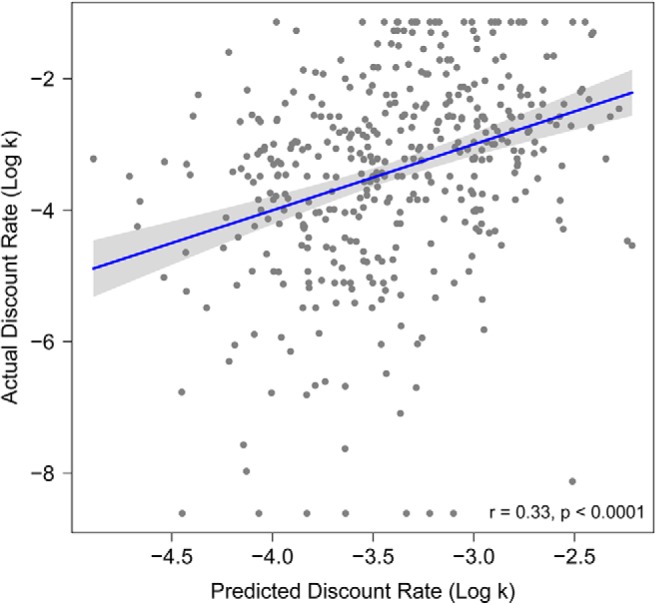
Figure 7.

CT data from structural covariance networks predicts delay discounting. Scatterplot for relationship between actual log k values and predicted log k from multivariate CT prediction. Multivariate prediction is based on CT scores from all structural covariance networks plus demographic variables: sex and age. Scatterplots include line of best fit for this association with a 95% confidence interval (gray envelope).
