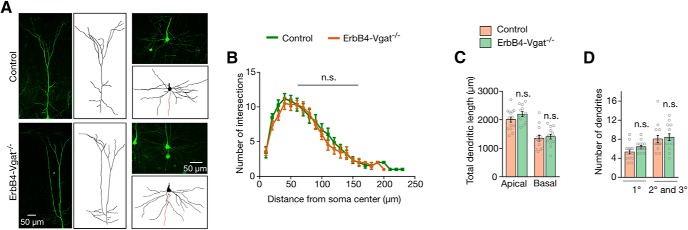
Figure 11.
Normal development of pyramidal neurons in ErbB4-Vgat−/− mice. A, Representative images and associated 3D reconstructed images of pyramidal neurons. B, No change in dendritic complexity, which was revealed by Sholl analysis at 10 μm concentric circles around the soma. C, Quantitative analysis of total dendritic length. D, Quantitative analysis of dendritic branches. B–D, n = 15 and 12 neurons for apical dendrites and n = 15 and 14 neurons for basal dendrites, of control and ErbB4-Vgat−/− mice respectively, 3 control and 4 ErbB4-Vgat−/− mice. n.s., Not significant. Error bars indicate SEM.

