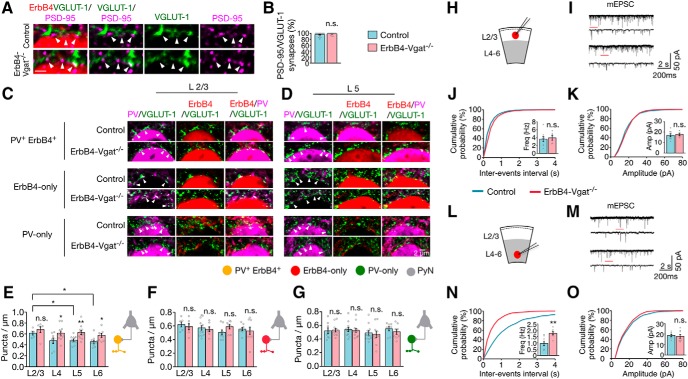
Figure 8.
Increased excitatory inputs onto PV+ErbB4+ interneurons in deep layers. A, VGLUT-1 punctae in contact or partial overlap with PSD-95 punctae. Cortical sections were stained with antibodies against VGLUT-1 and PSD-95, which were visualized by fluorescence-conjugated secondary antibodies (green and magenta, respectively). Genetically labeled ErbB4+ interneuron somas were represented in red (tdTomato). Arrowheads indicate Vglut-1 punctae in contact or partial overlap with PSD-95 punctae, representing excitatory synapses. B, Percentage of Vglut-1/PSD-95 punctae per soma (control, n = 19 somas; ErbB4-Vgat−/−, n = 17 somas, 3 mice per group). C, D, Representative images of excitatory axo–somatic synapses onto interneurons. Cortical sections of control and ErbB4-Vgat−/− mice were stained with antibodies against PV and VGLUT-1. Shown are L2/3 (C) and L5 (D) interneurons, where ErbB4+ somas were labeled in red (tdTomato), VGLUT-1 punctae in green, and PV in magenta. E–G, Quantitative analysis of excitatory synapses onto PV+ErbB4+ interneurons (E), ErbB4-only (F), and PV-only (G; n = 6 sections per mice; 5–7 somas per cortical layer per section, 3 mice per group). H, L, Schematics of whole-cell patch-clamp recordings of L2/3 (H) and L4–L6 (L) ErbB4+ interneurons in cortical slices. I, M, Representative traces of mEPSCs from L2/3 (I) and L4–L6 (M) ErbB4+ interneurons in control and ErbB4-Vgat−/− mice. Traces indicated by red lines are shown magnified below. J, K, No change in mEPSC frequency (J) and amplitude (K) in L2/3 ErbB4+ interneurons of ErbB4-Vgat−/− mice compared with controls. Control, n = 8 cells, 3 mice; ErbB4-Vgat−/−, n = 6 cells, 3 mice. N, O, Increased mEPSC frequency (N) and no change in mEPSC amplitude (O) in L4–L6 ErbB4+ interneurons of ErbB4-Vgat−/− mice compared with controls. Control, n = 8 cells, 3 mice; ErbB4-Vgat−/−, n = 8 cells, 3 mice. Shown are cumulative probability plots for interevent intervals and amplitudes of mEPSCs. Insets, Bar graphs for mEPSC frequency and amplitude. n.s., Not significant. Error bars indicate SEM. *p < 0.05; **p < 0.01.

