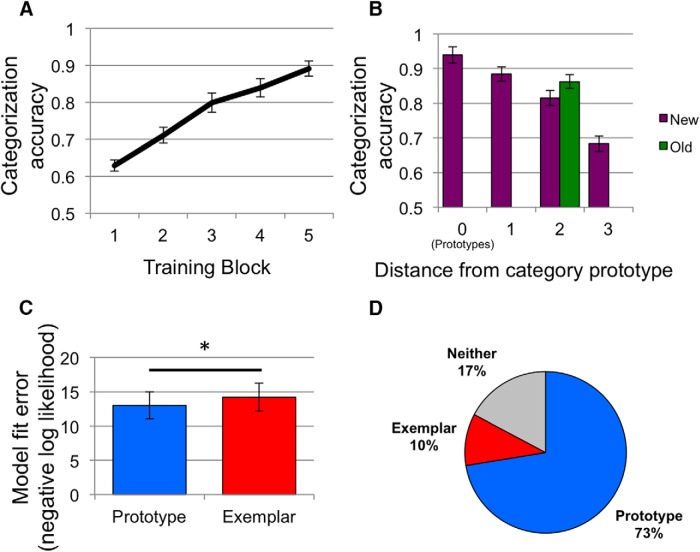
Figure 3.
Behavioral results. A, Proportion of correct categorization responses across five training blocks. B, Proportion of correct responses during the generalization test for test items at each distance from their respective category prototype. Separate accuracies are presented for training items (old; all distance 2) and new items. C, Model fit errors (negative log likelihood) for the prototype and exemplar models. Lower values indicate better fit. Asterisk represents a significant (p < 0.05) paired-samples difference in mean fit error between the models. In A–C, error bars represent across-subject SEM. D, The percentage of individual subjects best fit by the prototype model (blue), the exemplar model (red), and those for whom model fits did not differ significantly from one another (neither, gray).

