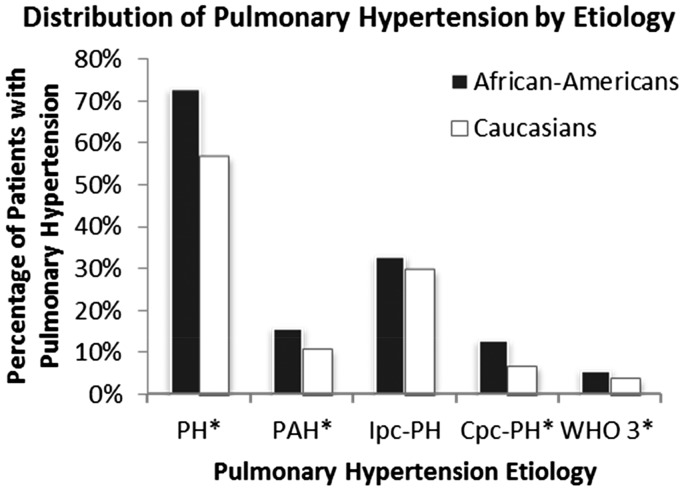
Fig. 2.
Bar graph showing distribution of PH by etiology, expressed as percentage of total number of African Americans (AAs, n = 586) and Caucasians (n = 3990) in our cohort. AAs had higher prevalence of PH (73% vs. 56%), PAH (16% vs. 11%), Cpc-PH (13% vs. 7%), and WHO group 3 PH (6% vs. 4%), but not Ipc-PH (33% vs. 30%). *P < 0.05.

