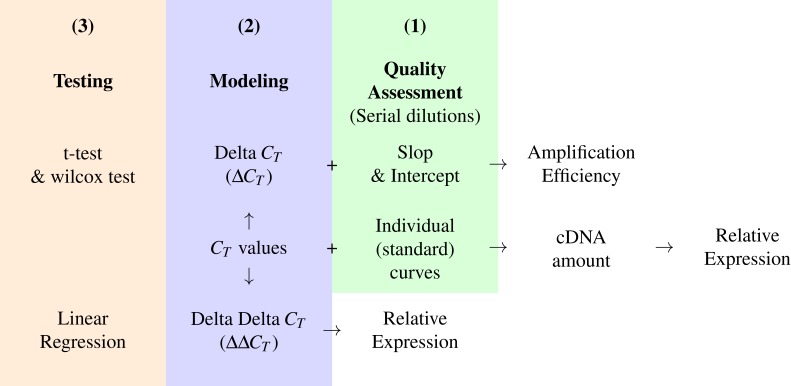
Figure 3. A conceptual workflow of the analysis of RT-qPCR data.
A graphic description of the input, intermediary values and final output of different steps of the analysis pipeline and their relations. Colors represent distinct steps and the numbers are the order in which they are applied in a typical analysis.

