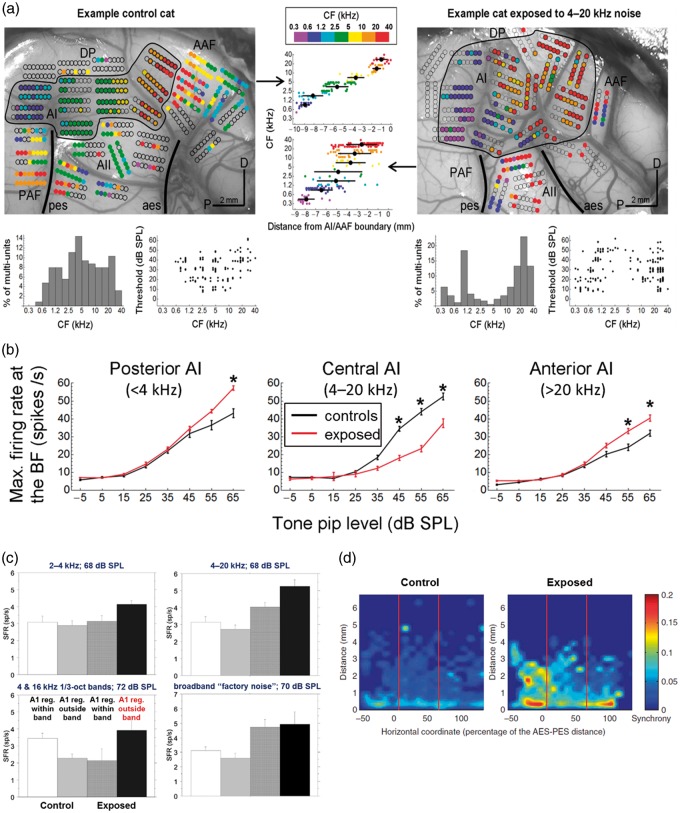
Figure 1.
(a) Multiunit (MU) spike recordings from ACx of a representative unexposed control adult cat (left) and an adult cat exposed for 2 months to 4 to 20 kHz band-pass noise at ∼70 dB SPL (right). MU characteristic frequencies (CFs) are color-coded (scale top-center) and superposed on photographs of the cortical surface. Blank circles indicate electrode penetrations that yielded insignificant sound-evoked activity. A1 is outlined and lightly shaded to distinguish it from surrounding auditory fields (AAF, PAF, A2, DP; scale bars: 2 mm; D: dorsal; P: posterior). CF–distance plots for MUs recorded in A1 are shown centered between the cortical maps; black circles give the mean positions ±1 SD of A1 units in each of the seven color-coded, octave-wide bins. The bottom row shows histogram distributions of A1 CFs and scatterplots of A1 response thresholds versus the CF. Note that noise exposure led to a clear underrepresentation of A1 units with CFs in the exposure frequency range and to an overrepresentation of A1 units with CFs above and below that range. That is, units with high and low CFs covered larger than normal areas of A1, and the thresholds and suprathreshold firing rates of these units were on average better than normal. Adapted from Pienkowski et al. (2011). (b) A1 MU rate-level functions averaged at the best frequency for unexposed control (black traces) and 4 to 20 kHz (2 months at 70 dB SPL) noise-exposed cats (red traces). Data were pooled by MU location in A1: “Posterior A1” spans a distance of 0% to 30% along the tonotopic gradient toward AAF and represents neurons normally tuned to <4 kHz (i.e., below the exposure range); “Central A1” spans a distance of 30% to 70% and represents neurons normally tuned to 4 to 20 kHz (within the exposure range); “Anterior A1” spans a distance of 70% to 100% and represents neurons normally tuned to >20 kHz (above the exposure range). Error bars show ±1 SE, and asterisks indicate post hoc Bonferroni tests significant at p < .05 (two-way ANOVA). Noise exposure induced neural hyperactivity in posterior and anterior A1 and neural hypoactivity in central A1. Adapted from Pienkowski et al. (2014). (c) Long-term exposure of adult cats to three different tone pip ensembles and to a broadband “factory noise” at ∼70 dB SPL generally increased A1 SFRs in the frequency regions outside of the exposure band (i.e., in the regions of neural hyperacusis; Figure 1(b)). Error bars show +1 SE. Adapted from Munguia et al. (2013), based on data replotted from Pienkowski and Eggermont (2010b; 2–40 kHz, 4 and 16 kHz), Pienkowski and Eggermont (2009; 4–20 kHz), and Pienkowski et al. (2013; “factory noise”). (d) Long-term exposure of adult cats to a 4 to 20 kHz tone pip ensemble at ∼80 dB SPL led to an increase in pairwise neural synchrony (quantified by ρ; color-code at right), particularly in A1 frequency regions outside of the exposure band. Figure reproduced from Noreña et al. (2006).
ACx = auditory cortex; SPL = sound pressure level; CF = characteristic frequency; AAF = anterior auditory field; PAF = posterior auditory field; ANOVA = analysis of variance; SFR = spontaneous firing rate.

