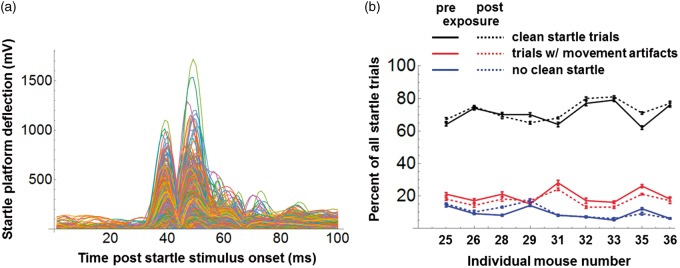
Figure 4.
(a) Complete set of “good” trials from a single example startle session. (b) Percentage of all startle trials, pre- and postexposure that were good trials (as in Figure 4(a); black traces), that were contaminated by nonstartle movements (red traces), and that lacked clear responses (blue traces). Data are shown for the nine individual mice (error bars give ± 1 SE).

