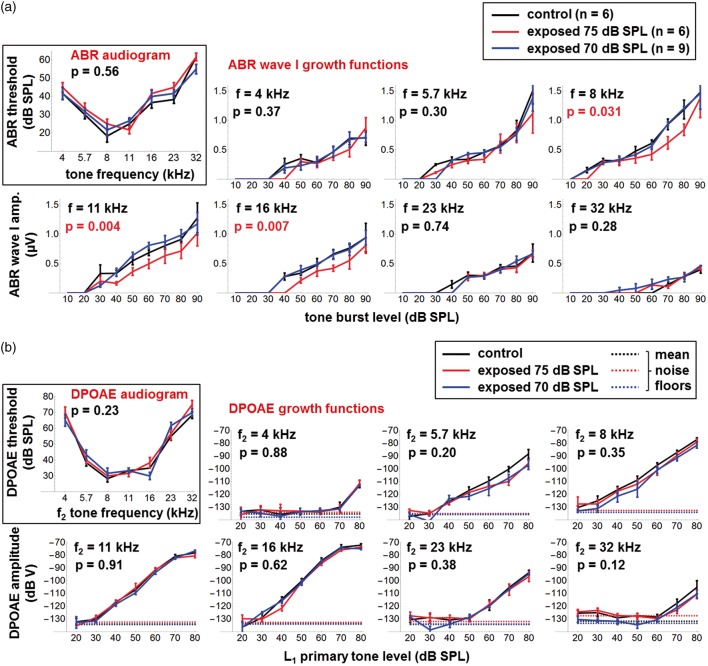
Figure 5.
(a) ABR audiograms and Wave 1 growth functions at different stimulus frequencies for unexposed control mice (black traces) and for mice exposed for 3 months to 8 to 16 kHz noise at 70 dB SPL (blue traces) and 75 dB SPL (red traces). Error bars show ±1 SE; p values are for the main effect of group across SPL (two-way ANOVA) and were not corrected for multiple comparisons at the different ABR frequencies. (b) As Figure 5(a) but showing DPOAE audiograms and growth functions at different stimulus frequencies for unexposed and exposed mice.
ABR = Auditory brainstem response; SPL = sound pressure level; ANOVA = analysis of variance; DPOAE = distortion product otoacoustic emission.

