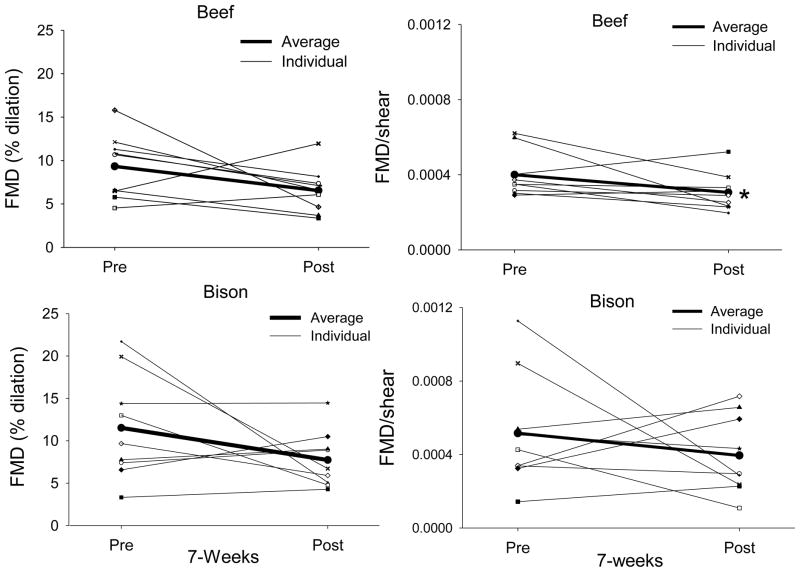
Fig. 4.
FMD (left column) and FMD/shear rate (right column) pre and post the 7-week intervention of beef (top) and bison meat (bottom). The bold line represents the mean value. Note that the effect of chronic beef consumption on FMD is more consistent than the effect of chronic bison consumption. Furthermore, expressing FMD relative to shear rate reduces the variability in dilation with beef, but not bison. * indicates a significant difference from pre values determined by a paired samples t-test (N=9).

