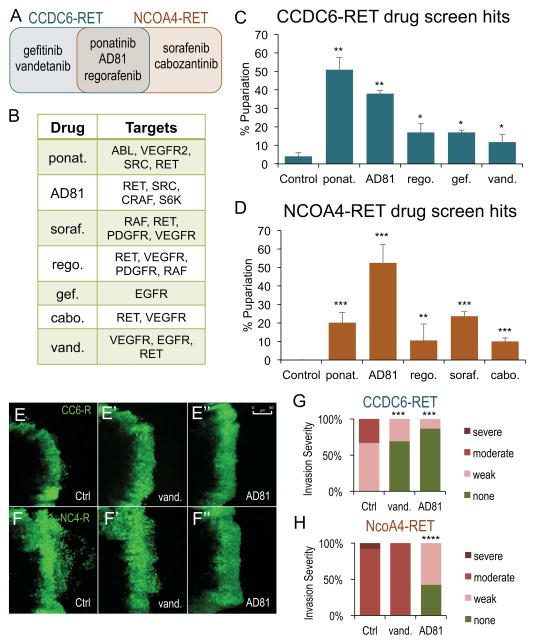
Figure 4. RET fusions were sensitive to shared and distinct kinase inhibitors.
A. Venn Diagram of the seven hits from drug screen that significantly increased the percent of experimental animals that pupariated when compared to control balancer flies. Figure S6 provides level of rescue of each hit. Table S1 shows the results for all 55 drugs tested and shows exact p values of significant hits.
B. Table indicating major targets of each kinase inhibitor.
C. Histogram showing the drug screen hits for tub>CCDC6-RET. Data are represented as mean +/− SEM. Asterisks: * p ≤ 0.05, ** p ≤ 0.01.
D. Histogram showing the drug screen hits for tub>NCOA4-RET. Data are represented as mean +/− SEM. Asterisks: ** p ≤ 0.01, **** p ≤ 0.001.
E–E″. Third instar larval ptc>CCDC6-RET wing discs. The ptc domain is visualized with ptc>GFP. In contrast to DMSO controls, 100 μM vandetanib and 100 μM AD81 blocked low level cell invasion. Scale bar in E″ represents 50 μm in E–F″.
F–F″. Third instar larval ptc>NCOA4-RET wing discs. In contrast to DMSO controls, AD81 blocked the extensive cell invasion phenotype while vandetanib had no impact on migrating cells.
G. Quantification of the severity of cell migration in ptc>CCDC6-RET animals fed DMSO, vandetanib, or AD81. Figure S8 shows the number of wing discs that scored in each of the four categories and provides p values for both ptc>CCDC6-RET and ptc>NCOA4-RET.
H. Quantification of the severity of cell migration in ptc>NCOA4-RET animals fed DMSO, vandetanib, or AD81.
See also Figure S6 and S7, Table S1

