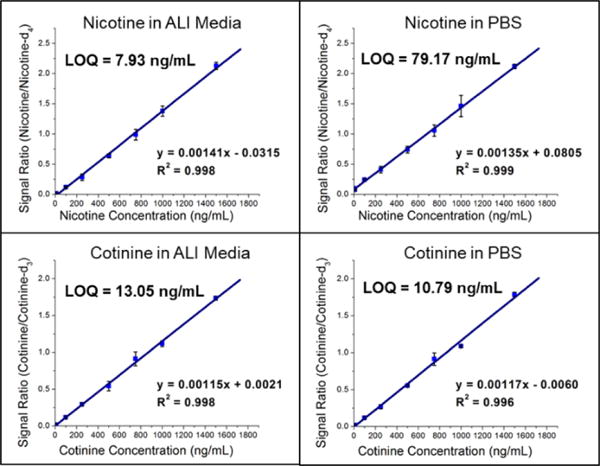
Figure 2.

Calibration curves (unweighted) of nicotine and cotinine in ALI and PBS from the pre-exposure HTBECs experiments using the Velox 360 and Thermo LTQ-FT. Bars represent standard deviation of triplicate measurements at each concentration. Limit of quantitation (LOQ) were calculated as , where σ0 is the standard deviation of the 0 ng/mL measurements and s is the sensitivity of the method.
