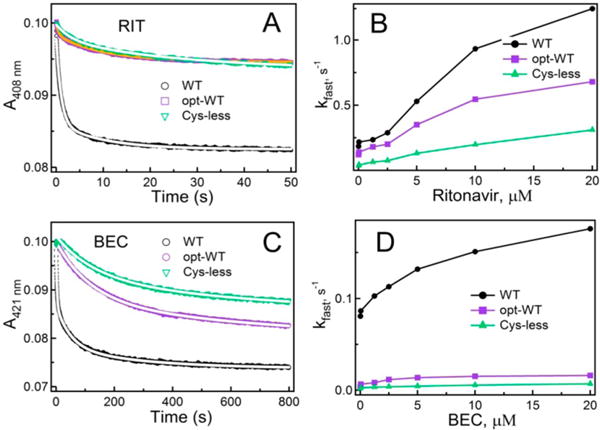
Figure 3.

Kinetics of RIT and BEC binding to WT, opt-WT, and Cysless CYP3A4 measured at ambient temperature in 0.1 M phosphate buffer (pH 7.4). (A and C) Kinetic traces recorded in a stopped flow spectrophotometer after mixing 2 μM CYP3A4 with 40 μM RIT and BEC, respectively. Reactions were biphasic under all studied conditions. Fitting curves are shown as white solid lines. (B and D) Dependence of the observed rate constant for the fast phase (kfast) on the concentration of RIT and BEC, respectively. The kfast and kslow values measured at the maximal ligand concentration are listed in Table 1.
