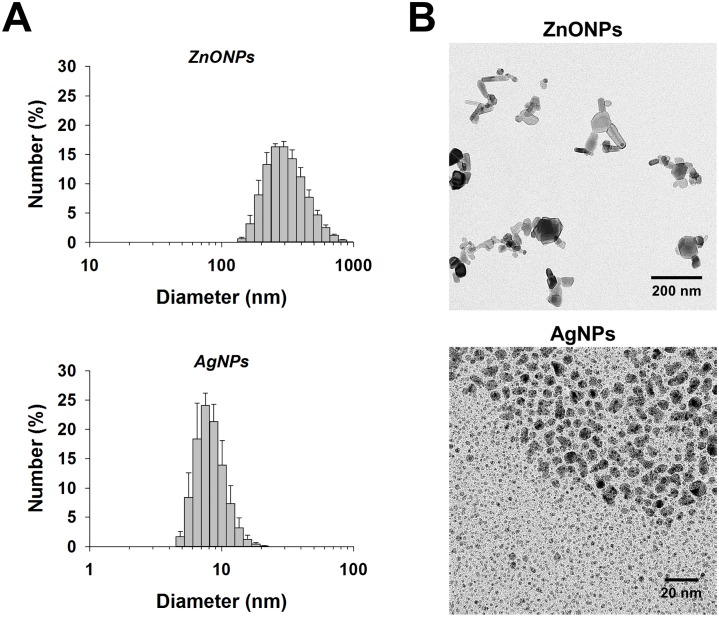
Fig 1. Size characterization of nanoparticles.
(A) Dynamic light scattering (DLS) was used to assess the size of ZnONPs and AgNPs. Mean ± SEM are presented (n ≥ 3). (B) Transmission electron microscopy images of ZnONPs and AgNPs (Note: the scale bars are 200 and 20 nm for ZnONPs and AgNPs, respectively).

