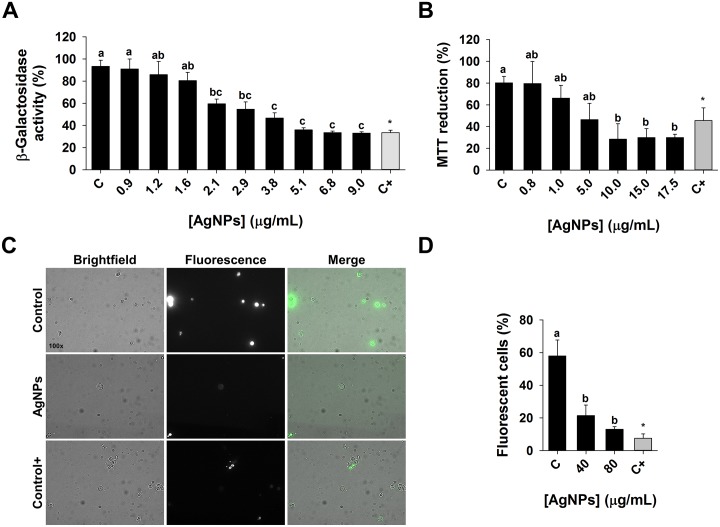
Fig 5. Transcription rate, cellular respiration, and endocytosis in yeast cells exposed to AgNPs.
(A) β-galactosidase reporter gene expression assay was used to estimate transcription rate in response to AgNPs or 6-azauracil (positive control). β-galactosidase activity in treatments is expressed relative to no-AgNPs control (negative control). (B) MTT reduction assay was used to estimate cellular respiration in response to AgNPs or sodium azide (positive control). (C) Brightfield, fluorescence, and merged images of negative control, AgNPs (80 μg/mL), and positive control (NaN3) groups. The cells that internalized Lucifer Yellow (LY) are fluorescent. (D) The uptake of LY was used to estimate endocytosis in response to AgNPs. Percentage of fluorescent cells relative to control was determined by examining at least 6 different fields, each with >20 cells. Mean ± SEM are presented (n ≥ 3). Significant differences are indicated with letters.

