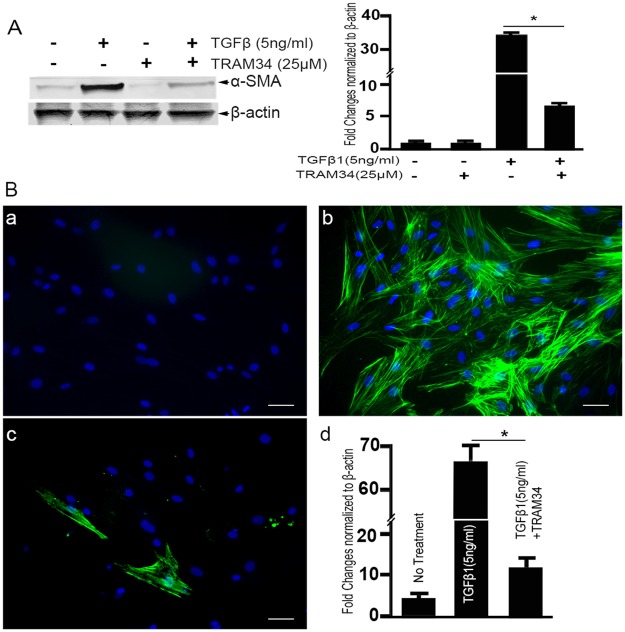
Fig 7.
Western blot analysis (A) and quantification RT-PCR showing the effect of TRAM-34 treatment on α-SMA protein expression. A prominent α-SMA band was detected in the cellular lysate of TGFβ1 treated HCFs. TRAM-34 treatment attenuated TGFβ1 induced α-SMA expression. Corresponding densitometry analysis of the Western blot is presented in (B). Representative immunostaining images (a, b, c) and their quantification, showing the effect of TRAM-34 treatment on α-SMA protein expression in HCFs. Sparse α-SMA staining (green) can be seen in (a) control (no treatment) cultures compared with cultures grown in the presence of (b) TGFβ1 (+TGFβ1). TRAM-34 (25 μM) +TGFβ1 treatment resulted in a significant decrease in α-SMA (c). Scale bar = 50 μm. The quantitation graph demonstrates a 66% increase in the number of α-SMA positive cells (*p<0.001) when compared with no treatment control, which was significantly attenuated with TRAM34 treatment (p<0.001). (α-SMA = green, DAPI = Blue).

