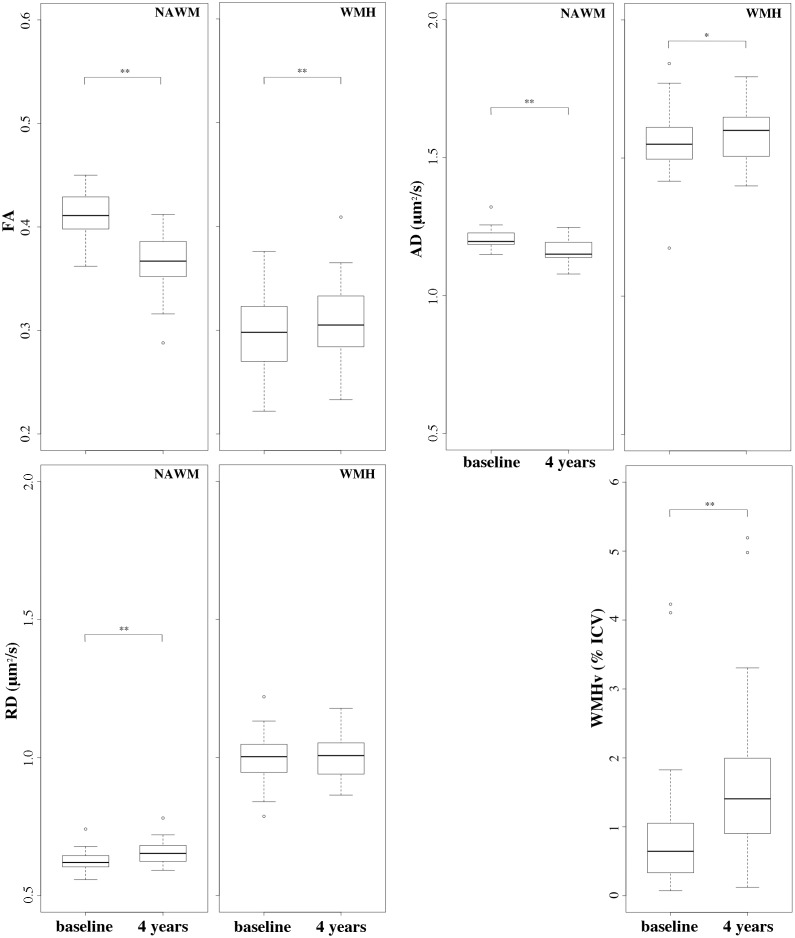
Fig 5. Baseline and 4-year FA, AD and RD indices in supratentorial WM.
Boxplots illustrate the DTI indices values distribution (y-axis) at baseline and at 4-years (x-axes) in the completers-only sample (N = 41). Top left: fractional anisotropy (FA, arbitrary units) within normal-appearing white matter (NAWM) and WMH for comparison. Top right: axial diffusivity (AD, μm2/sec) within NAWM and WMH. Bottom left: radial diffusivity (RD, μm2/sec) within NAWM and WMH. Bottom right: white matter hyperintensity volume (WMHv, as percent of the intracranial cavity volume, i.e. % ICV). Statistical significance assessed with Wilcoxon signed rank paired sample test: * p<0.05; ** p<10−3.

