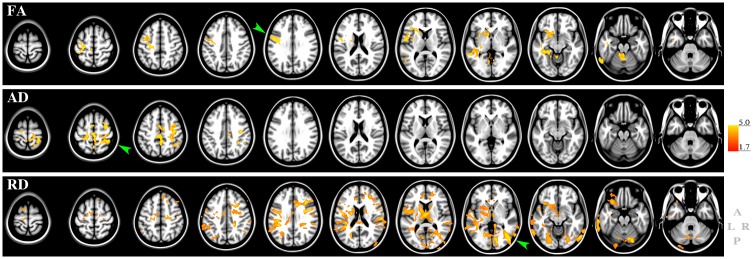
Fig 6. Voxel-wise analysis of DTI and Tinetti mobility.
The figure shows the results of the voxel-wise general linear model statistics to assess association between changes in Tinetti total mobility score and changes in brain DTI indices. Top: FA; middle: AD, bottom: RD. The red-to-yellow colors indicate the T-values in areas of significant association. The bar on the right represents min and max of the T-value (1.7 to 5.0) for a one-tailed threshold of p<0.05 at the voxel level. The higher the T the more significant is the association. Results are overlaid on the Montreal Neurological Image brain template for anatomical reference. Green arrowheads indicate areas with highest significance. Image orientation is shown at bottom right: anterior (A), posterior (P), left (L) and right (R).

