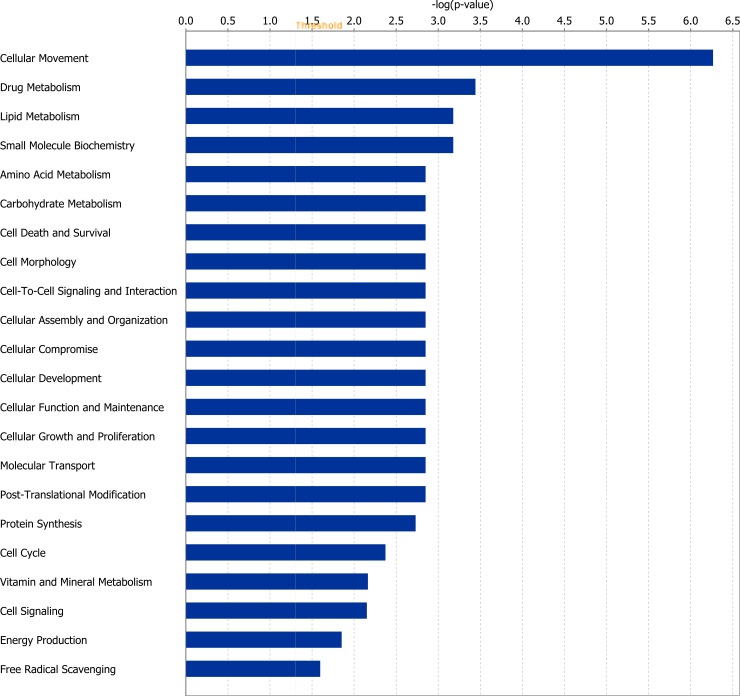
Fig 2. Differentially expressed genes as a consequence of compensatory growth (RES Period 1 v RES Period 2) classified according to molecular and cellular function.
The bars indicate the likelihood [-log (P value)] that the specific function was affected by dietary restriction compared with others represented in the list of differentially expressed genes.

