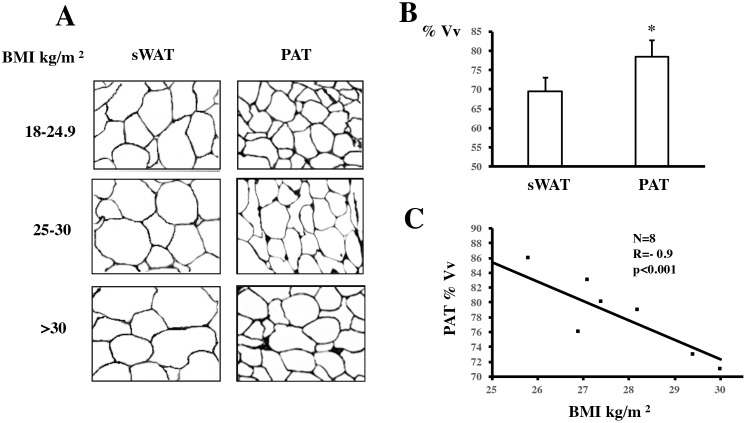
Fig 1. Morphology of subcutaneous adipose tissue (sWAT) and periaortic adipose tissue (PAT) adipocytes.
(A) Representative images of formaldehyde-fixed sWAT and PAT samples obtained from patients with normal (18–24.9 kg/m2), overweight (25–29.9 kg/m2), and obese (>30 kg/m2) body mass index (BMI). (B) Quantification of volume density was performed on the captured images, which were performed by M42 (multipurpose test-system) The percentage of adipocyte volume densities were performed and (*) p<0.05 indicates a statistically significant difference between sWAT and PAT adipocyte volume density. (C) Correlation between BMI and adipocyte volume density in PAT as calculated with Pearson’s correlation (r = -0.91, p<0.01). Data are expressed as mean ± SD (n = 8). A paired t-test was performed to determine differences between averages.

