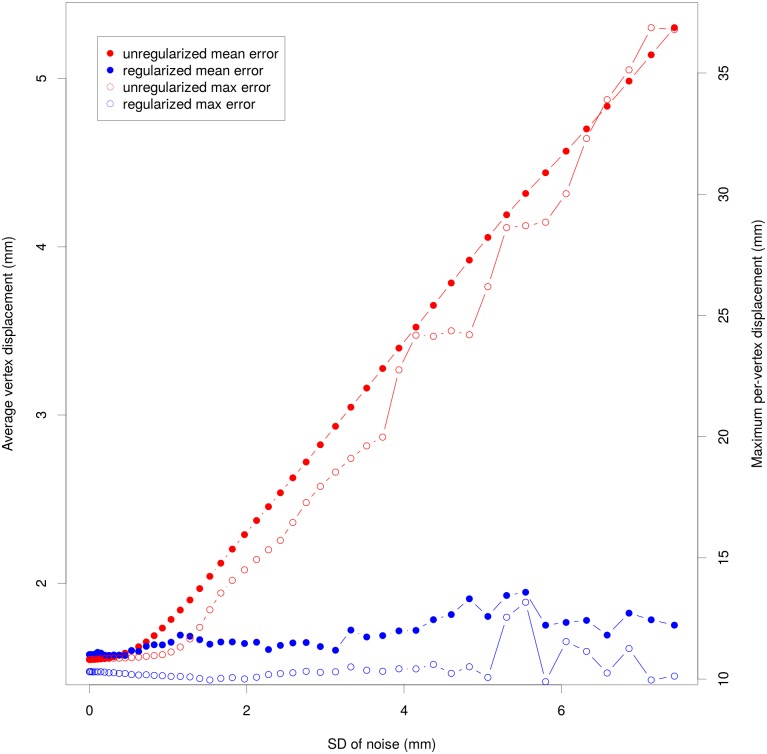
Fig 10. Effect of asymmetric noise on retrodeformation error (Gorilla case study).
Using 200 semi-landmarks, this figure shows the effect of noise in regard to mean and maximum per-vertex error. Blue solid dots: mean error of our proposed regularized method; Mean (solid circles and left y axis) and maximum (open circles and right y axis) error of proposed regularized method (blue) and unregularized retrodeformation (red).

