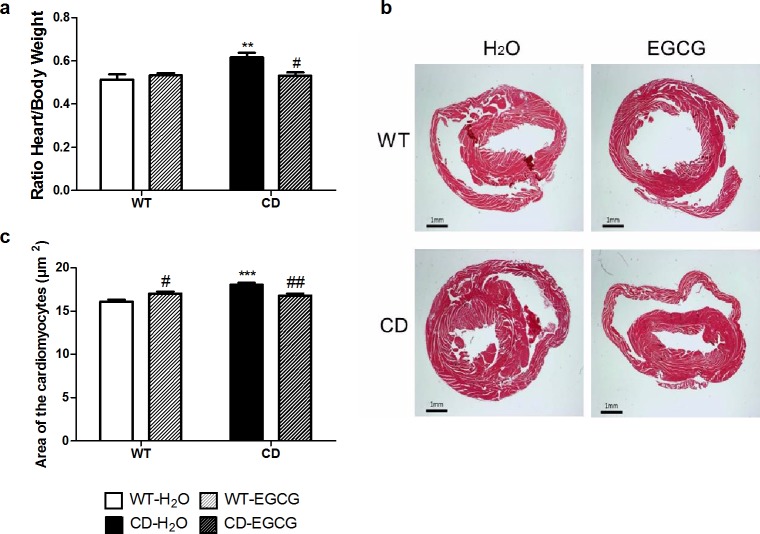
Fig 5. EGCG treatment prevents the cardiac hypertrophy observed in CD mice.
(a) Comparison of the heart/body weight ratios obtained from each genotype showed that cardiac hypertrophy present in CD mice is not observed after EGCG treatment. A two-way ANOVA indicated a significant interaction between genotypes and treatment (F1,46 = 7.237, p = 0.0099), with a significant effect of genotype (F1,46 = 6.751, p = 0.0125) but with treatment effect only in CD mice (p<0.01, Bonferroni post hoc test). n = 10–15 mice per group. (b) Representative images of hematoxylin-eosin stained transverse sections of heart samples. We can appreciate the thickening of the left ventricular wall of the control CD animals. (c) CD mice cardiomyocytes are significantly larger than in WT animals, while CD animals treated with EGCG show normal cell size. A two-way ANOVA indicated a significant interaction between genotypes and treatment (F1,12 = 24.05, p = 0.0004), with a significant effect of genotype (F1,12 = 14.15, p = 0.0027) and treatment effect in CDs (p<0.01, Bonferroni post hoc test) but also in WTs (p<0.05, Bonferroni post hoc test). n = 4 mice/group. p values are shown with asterisks (genotype) or hashes (treatment) indicating values that are significantly different (Two-way ANOVA with Bonferroni post hoc test). *,#p<0.05; **,##p<0.01; ***,###p<0.001. White, WT; Black, CD. Plain, water; Striped, EGCG. Data are presented as the mean ± SEM.

