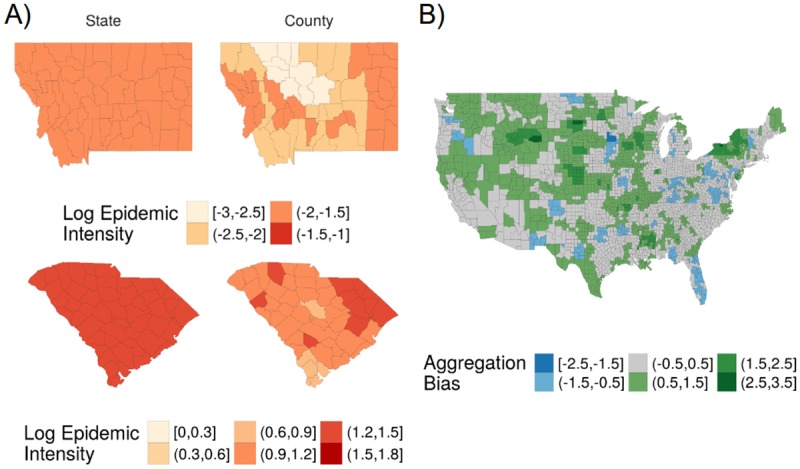
Fig 3. Discrepancies between state and county surveillance models for epidemic intensity.

A) Comparison of state and county surveillance models (left and right columns, respectively) for log epidemic intensity for states with overestimation and underestimation with the state surveillance model —Montana (top row) and South Carolina (bottom row), respectively. B) Aggregation bias between county and state epidemic intensity surveillance models for the 2006-2007 influenza season, where error is defined as the difference between fitted values for county and state log epidemic intensity. Negative error (blue) indicates that the state-level surveillance model underestimated risk relative to the county-level surveillance model, and vice versa.
