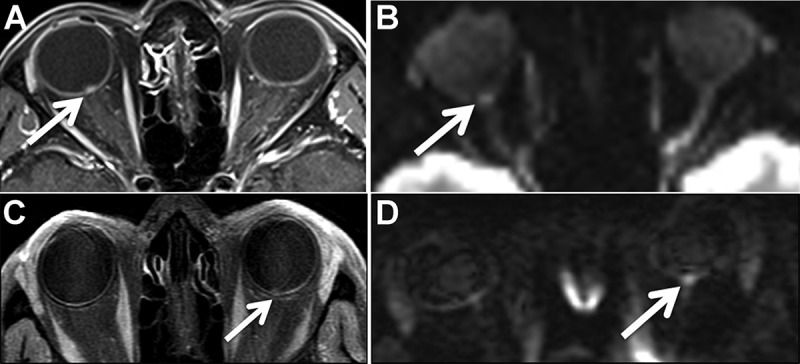
Figure 1.

Imaging findings in non-arteritic anterior ischaemic optic neuropathy. Focal enhancement at the optic disc on the post-contrast T1-weighted image (A) with fat saturation (arrows). The diffusion-weighted image (B) shows focal diffusion restriction at the optic disc (arrows). The hyperintensity seen in the left optic nerve is volume averaging, and not true diffusion restriction. (C, D) Focal enhancement at the right optic disc with associated diffusion restriction (arrows).
