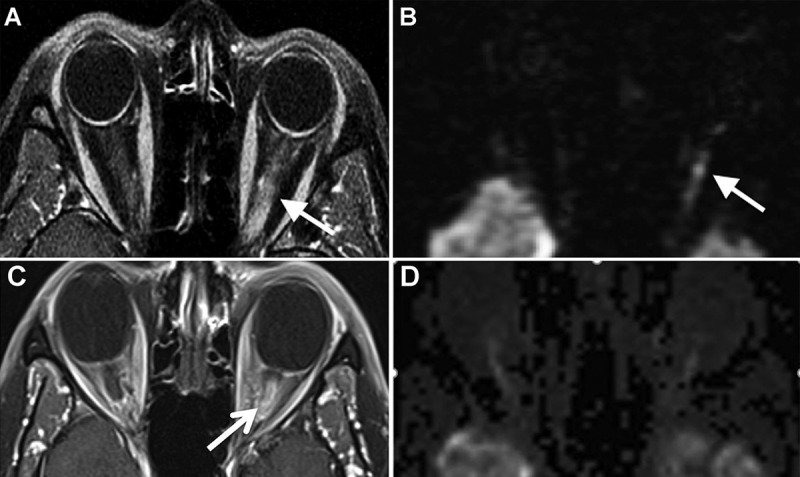
Figure 3.

Imaging findings in optic neuritis. The axial post-contrast T1-weighted image (A) shows enhancement of the intraorbital segment of the left optic nerve (arrow). The diffusion-weighted image (B) shows hyperintensity within the left intraorbital optic nerve. The axial post-contrast T1-weighted image with fat saturation (C) shows marked enhancement and enlargement of the intraorbital segment of the left optic nerve (arrow). The corresponding diffusion-weighted trace image (D) shows no convincing areas of diffusion restriction within the nerve.
