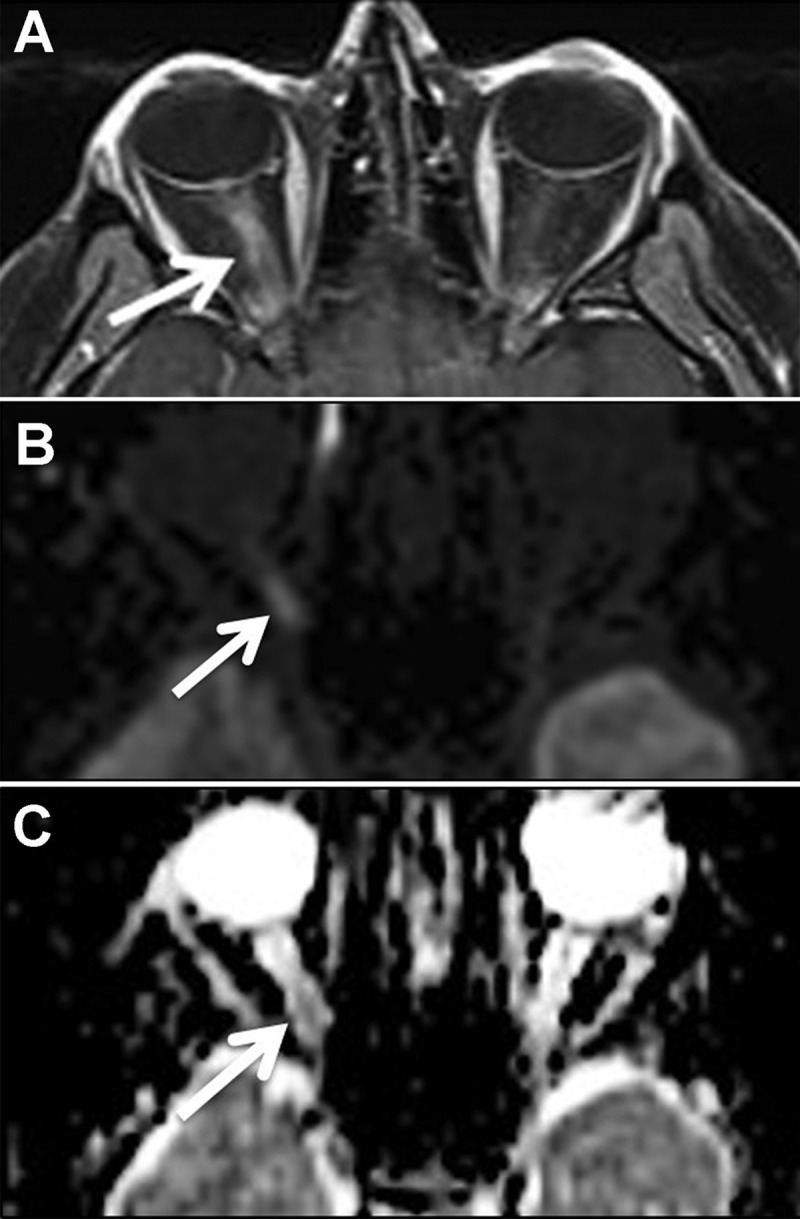
Figure 4.

Imaging findings in optic neuritis. The axial post-contrast T1-weighted image (A) shows enhancement and enlargement of the intraorbital segment of the right optic nerve. The axial diffusion-weighted trace image (B) shows associated hyperintensity in the same distribution (arrow). The apparent diffusion coefficient (ADC) map (C) shows decreased signal in the same region correlating with the area of diffusion restriction.
