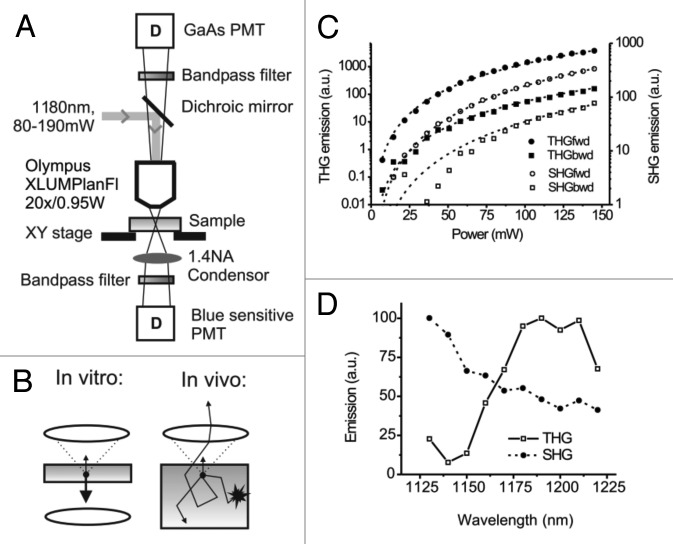
Figure 1. Beam path and efficiency of forward and backward third- and second-harmonic generation. (A) Beam path and main components of the multiphoton microscope including detectors (D) and numerical aperture (A). (B) Detection of THG and backward scattered emission from thick light-absorbing in vivo samples (right), compared with THG detection of most in vitro or thin ex vivo samples (left). (C) THG and SHG emission from mouse fibrosarcoma (MCA-101) cells embedded in collagen matrix, as a function of excitation power. Emission was detected in the forward (fwd) and backward (bwd) direction. To separate emission from the background, images were background subtracted and thresholded before the average intensity was calculated in regions of interest containing SHG or THG emitting structures (collagen, intracellular vesicles). THG emission showed best fit with a model function dependent on the third-order of the excitation power (reduced-Chi-sqr = 5 and 52 for forward and backward detection, respectively; dashed lines; 5% relative error in excitation power), whereas SHG emission showed best fit with second-order excitation (Chi-sqr = 0.58 and 360 for forward and backward detection, respectively). (D) THG and SHG excitation spectra of the structures of the mouse dermis in backward direction (compare to Fig. 3). Images were acquired using a custom Python script, controlling OPO wavelength, attenuator and tube lens settings to maintain constant excitation power (100 mW) and focal plane over the scanned wavelength range (1130–1220 nm). Curves were normalized to take fluctuations of the laser power into account.

An official website of the United States government
Here's how you know
Official websites use .gov
A
.gov website belongs to an official
government organization in the United States.
Secure .gov websites use HTTPS
A lock (
) or https:// means you've safely
connected to the .gov website. Share sensitive
information only on official, secure websites.
