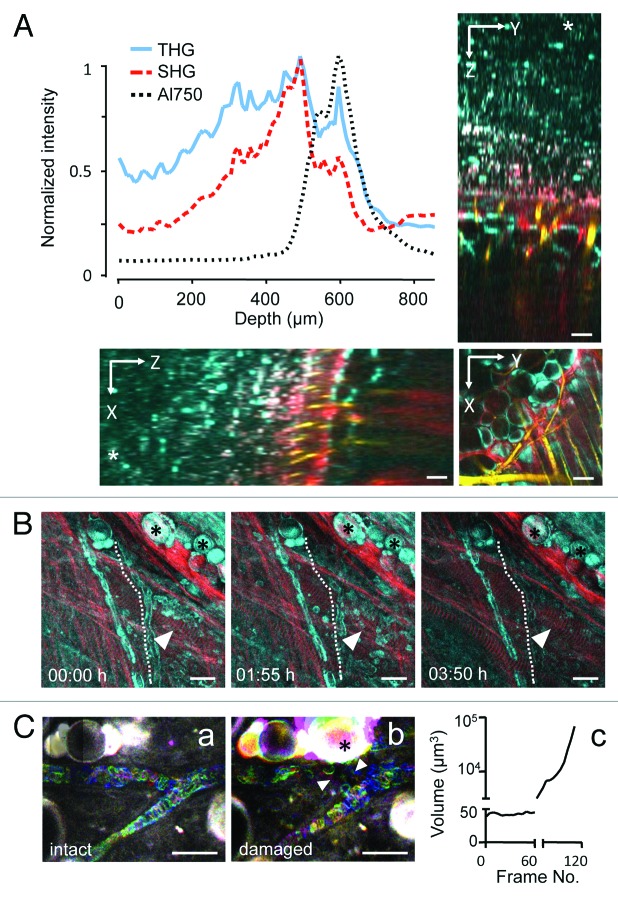
Figure 2. Depth efficiency and phototoxicity of backward THG. (A) THG, SHG and AlexaFluor750 signal intensity as function of depth obtained from a 870 µm deep z-stack into the mouse dermis (*, level of the cover glass above the tissue). Images were acquired with a z-resolution of 10 µm, excitation wavelength of 1180 nm and an excitation power of 150mW under the objective. Images were background subtracted and average intensity of THG/SHG or AlexaFluor750 signals over the z-profile was plotted. THG (cyan) was detected up to 650 µm, similarly to SHG (red) and AlexaFluor750 (yellow). (B) Representative time points of THG (cyan) and SHG (red) during time-lapse recording of dermal tissue [λ(excitation) = 1180nm; 110mW excitation power under the objective]. Z-scans of 80 µm tissue volume were acquired with z-steps of 5 µm and frame intervals of 60 sec (230 frames; 3.8 h observation period). Unperturbed tissue structures, including fat cells (asterisks), muscle fibers (arrowheads) and erythrocyte flow in capillaries (dotted line). (C) Erythrocyte flow (temporal color coded) morphology of adipocytes (asterisk). (a) Continuous exposure of small (60 µm × 70 µm) scan field for 60 frames (frame rate: 1.1/sec) at 1180nm excitation and 130mW excitation intensity. (b and c) Doubling of the frame rate (0.6/sec) followed by tissue damage, detected by swelling of adipocytes (asterisk) and intravascular coagulation and perturbed erythrocyte flow (arrowheads). Scale bars, 20µm.

An official website of the United States government
Here's how you know
Official websites use .gov
A
.gov website belongs to an official
government organization in the United States.
Secure .gov websites use HTTPS
A lock (
) or https:// means you've safely
connected to the .gov website. Share sensitive
information only on official, secure websites.
