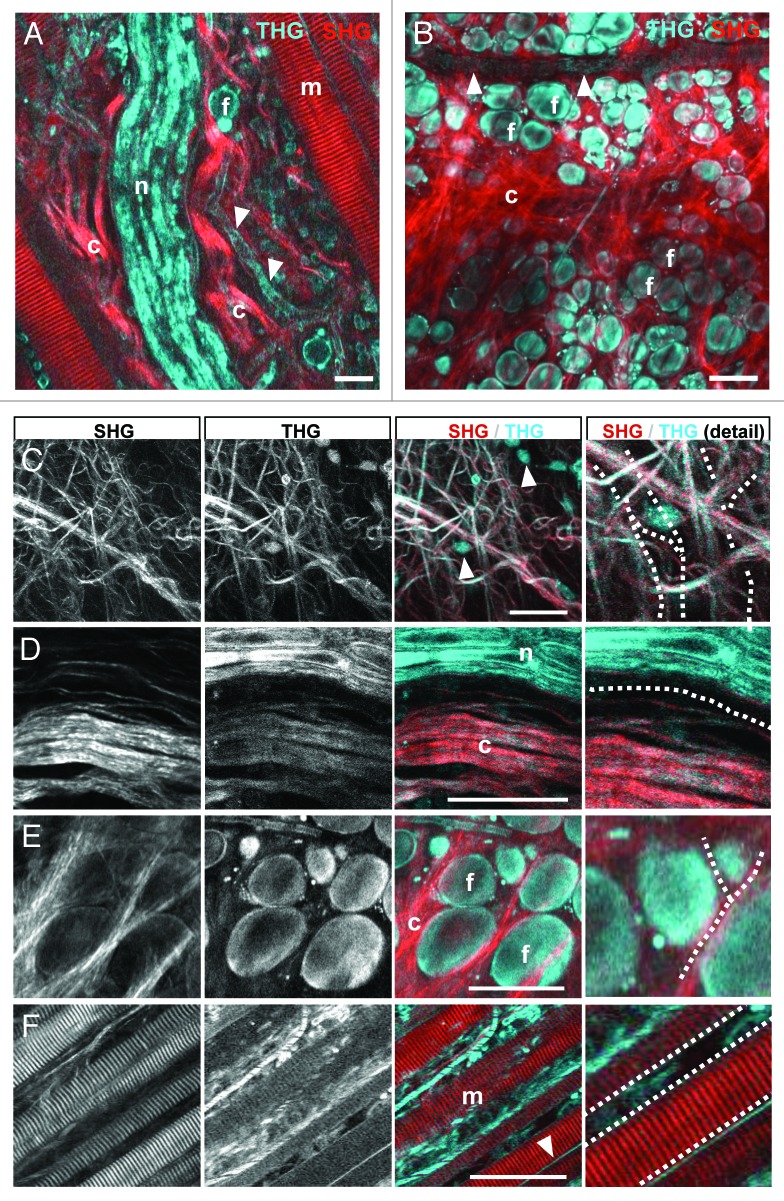
Figure 3. THG/SHG 3D reconstruction of tissue interfaces in native dermis. Backward THG/SHG were acquired at 1180nm excitation and 100–130mW laser intensity under the objective. THG was generated by cellular interfaces of fat cells (A, B and E); flowing erythrocytes labeling perfused blood vessels (A and B; arrowheads); cell bodies interspersed in loose connective tissue (C; arrowheads); matrix interfaces including collagen fiber bundles (C and D); peripheral nerves (A, D); striated muscles (F) and outer membranes of myofibers (F; arrowhead). SHG was confined to collagen bundles (A, B and D) and striated muscle fibers (A and F). Combined THG/SHG revealed tissue tracks and spaces available for tumor cell invasion (examples highlighted in C-F as dotted lines). Scale bars, 50µm. F, fat cells; m, myofiber; n, nerve; c, collagen.

An official website of the United States government
Here's how you know
Official websites use .gov
A
.gov website belongs to an official
government organization in the United States.
Secure .gov websites use HTTPS
A lock (
) or https:// means you've safely
connected to the .gov website. Share sensitive
information only on official, secure websites.
