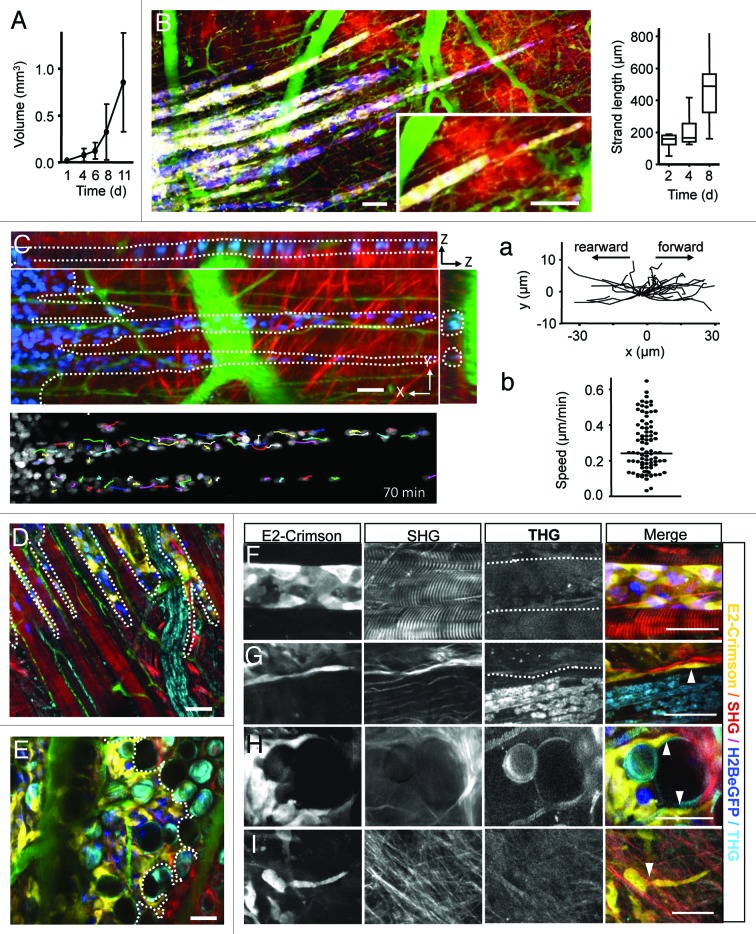
Figure 4. B16F10 melanoma invasion along dermal tissue interfaces. (A) B16F10 tumor volume growth over time. Error bars, mean ± SD (n = 8). (B) File-like collective invasion of mosaic tumors (compare to Fig. S2 ) into the deep dermis. Invasion strands progressed on average 70 µm/d (right graph) and appeared as coherent and tightly organized cell strains of near-constant diameter, except for occasional detachment of single cells or small cell files at the tip of the strands (B, inset). (C) Time-lapse microscopy and single-nucleus tracking show high intra-strand dynamics in rearward and forward direction (a) with median velocities of 0.25 µm/min (b). During migration individual tumor cells remained within the 3D spaces defined by tissue interfaces (C, dotted lines) with leading edges strongly adapted to tissue confinement (D and E; dotted lines). Linear, aligned tracks along muscle fibers and nerves guiding file-like collective invasion (D), while irregular shaped spaces within fat tissue supported broad and diffusely organized collective invasion patterns (E). Invading tip cells preferentially moved along tissue interfaces such as linear perimuscular (F; dotted lines) and perineural (G; dotted lines) tracks, and irregular trails consisting of adipocyte interfaces (H) or collagen fiber networks (I). Cell body adapting to existing matrix spaces (F–I; arrowheads). Backward THG/SHG, E2-Crimson and AlexaFluor750 were excited with 1180nm (100–130mW), eGFP was excited with 910nm (20–40 mW). Color scale: yellow, E2-Crimson (tumor cytoplasm); blue, histone-2B/eGFP (tumor nuclei); green, AlexaFluor750 (blood vessels); red, SHG; cyan, THG. Scale bars, 50 µm.

An official website of the United States government
Here's how you know
Official websites use .gov
A
.gov website belongs to an official
government organization in the United States.
Secure .gov websites use HTTPS
A lock (
) or https:// means you've safely
connected to the .gov website. Share sensitive
information only on official, secure websites.
