
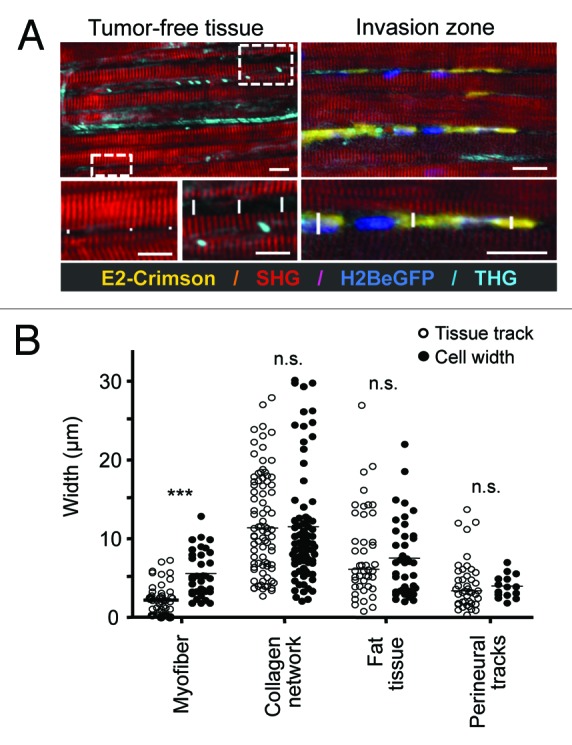
Figure 5. Quantification of native tissue spaces and tumor cell adaptation to pre-existing tissue tracks. (A) The diameter of tumor-free tissue tracks quantified from THG and SHG imaging (left) was compared with the diameter of invading cells, visualized by fluorescence of the cytoplasm and/or the nucleus. As example, perimuscular invasion is shown. Scale bar: 20µm. (B) Diameters of THG-/SHG-negative spaces and tracks in native, tumor-free tissue, compared with the diameter of tumor cell bodies during invasion. Tracks along myofibers were significantly widened by tumor cell infiltration (two-tailed Mann-Whitney test; *** = p < 0.0001), while all other tissue tracks maintained their original dimensions and required tumor cell adaptation (n.s., not significant). For each condition, at least three independent tissue samples were quantified.