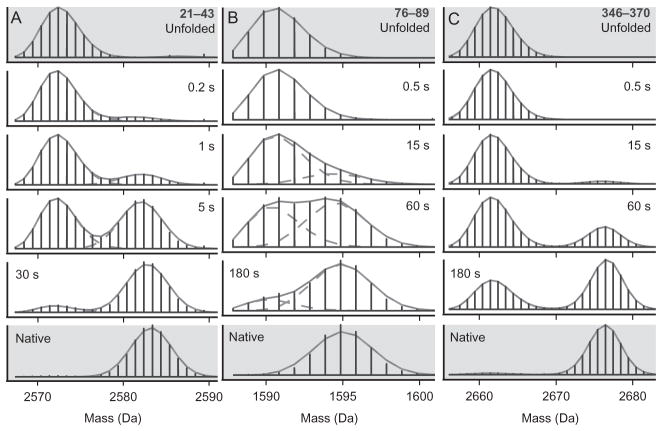
Figure 5.
Example data from a pulsed labeling experiment following the folding of maltose binding protein (MBP) showing bimodal isotopic distributions. Three peptides are shown. Residues 21–43 (A), 76–89 (B), and 346–370 (C). Folding time before the labeling pulse is indicated. In this case, starting with all D unfolded protein, the heavy fraction reflects protein molecules that were protected from exchange during a 43-ms, pH 9 pulse. Different parts of the protein acquire protecting structure at different times after folding starts showing the progressive formation of the native structure. The data shown in gray are from unfolded and native control experiments and show that the protected and unprotected fractions behave like fully folded and unfolded protein. The fits are with binomials. A concerted EX1 exchange mechanism will yield similar data. From Walters et al. (2013).

