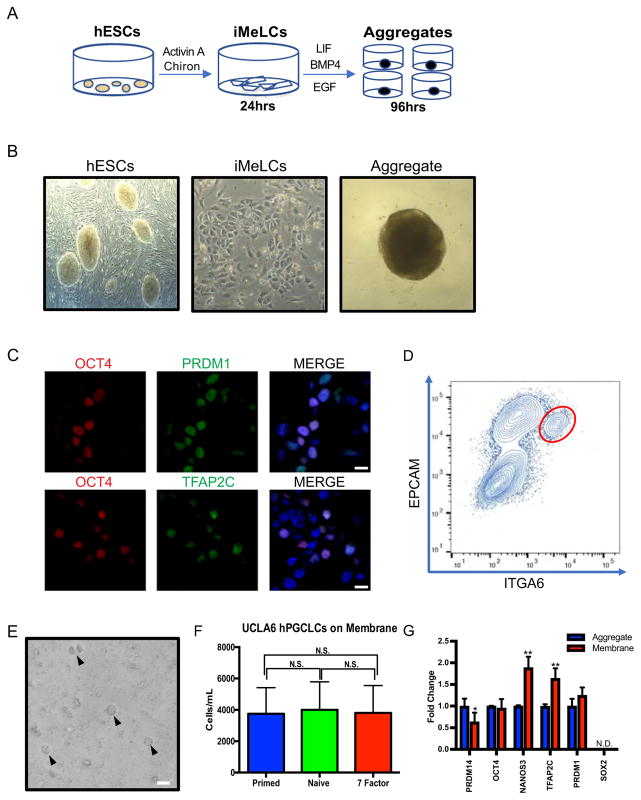
Fig. 3. PGCLCs can be cultured on transwell membranes for at least four days.
A. Two-step differentiation model to generation PGCLCs from hESCs.
B. Bright filed images of hESCs, iMeLCs, and an aggregate generated through the two-step differentiation model.
C. IF of UCLA6 day 4 aggregates containing OCT4/PRDM1 (top) and OCT4/TFAP2C (bottom) positive PGCLCs. Scale bars, 15 μm.
D. FACS analysis of day 4 aggregates, red circle represents ITGA6/EPCAM double positive PGCLCs.
E. Bright field image of PGCLCs sorted according to D, followed by four additional days of culture on transwell membranes. Triangles denote individual PGCLCs. Scale bar, 20 μm.
F. Cell counts of PGCLCs isolated from UCLA6 day 4 aggregates by FACS according to D, followed by 4 days of additional culture on transwell membrane in medias indicated. Primed hESC media, naïve hESC, and 7-factor media, respectively. N.S. = not significant. Three independent experiments were performed.
G. Gene expression of PGCLCs sorted from UCLA6 aggregates at day 4 (blue) according to D, and after 4 days of additional culture on transwell membrane in 7-factor media (red). Three independent experiments were performed. **p < 0.0001, *p < 0.001.

