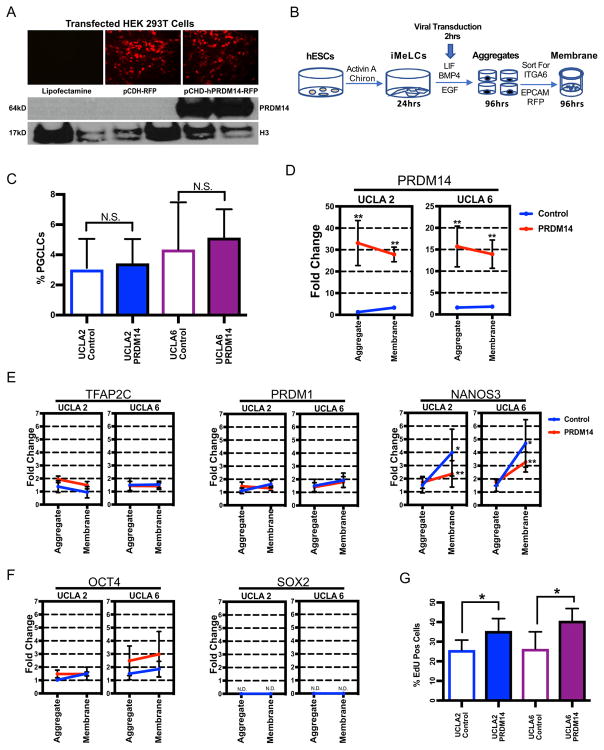
Fig. 4. PGCLCs constitutively overexpressing PRDM14 fail to increase NANOS3 and are more proliferative.
A. HEK 293T cells transfected with plasmid constructed to constitutively overexpress PRDM14. Images portraying no RFP signal in Lipofectamine control, positive RFP signal in pCDH-RFP (empty plasmid), pCDH-hPRDM14-RFP. Protein expression of PRDM14 in pCHD-hPRDM14-RFP confirmed with western blot. PRDM14 ~ 64 kD, H3 (loading control) ~ 17 kD. Two independent experiments were performed.
B. Experiment design for constitutive overexpression of PRDM14, using the two-step method of differentiation, day 4 PGCLCs were sorted by FACS by ITGA6/EPCAM and cultured for an additional 4 days on transwell membranes prior to analysis.
C. Percent of PGCLCs sorted from control and PRDM14 overexpressing aggregates, for both UCLA2 and UCLA6 hESC cell lines. Three independent experiments were performed for each cell line UCLA2 and UCLA6.
D. Gene expression level of PRDM14 in control (blue) and PRDM14 constitutive overexpression (red). Aggregate = PGCLCs isolated by FACS at day 4 for ITGA6/EPCAM. Membrane = ITGA6/EPCAM sorted PGCLCs cultured for four additional days on transwell membranes. ** = significance between control and PRDM14, p < 0.0001. Three independent experiments were performed for each cell line UCLA2 and UCLA6.
E. Gene expression levels of germ line genes, TFAP2C, PRDM1, NANOS3. Control (blue). PRDM14 overexpression (red). * = significance between aggregate and membrane, p < 0.0001. ** = significance between control and PRDM14 on membrane, p < 0.001. Aggregate = PGCLCs isolated by FACS at day 4 for ITGA6/EPCAM. Membrane = ITGA6/EPCAM sorted PGCLCs cultured for four more days on a transwell membrane. Three independent experiments were performed for each cell line UCLA2 and UCLA6.
F. Gene expression levels of pluripotency genes, OCT4 and SOX2 in control (blue) and PRDM14 overexpression (red). N.D. = none detected. Aggregate = PGCLCs isolated by FACS at day 4 for ITGA6/EPCAM. Membrane = ITGA6/EPCAM sorted PGCLCs cultured for four additional days on transwell membranes. Three independent experiments were performed for each cell line UCLA 2 and UCLA 6.
G. Percent of Edu positive PGCLCs on transwell membrane. * = significance between control and PRDM14, p < 0.05. PGCLCs for this experiment were differentiated for 4 days in aggregates before FACS using ITGA6/EPCAM to isolate PGCLCs. The sorted PGCLCs were cultured for an additional four days on transwell membranes. Three independent experiments were performed for each cell line UCLA2 and UCLA6.

