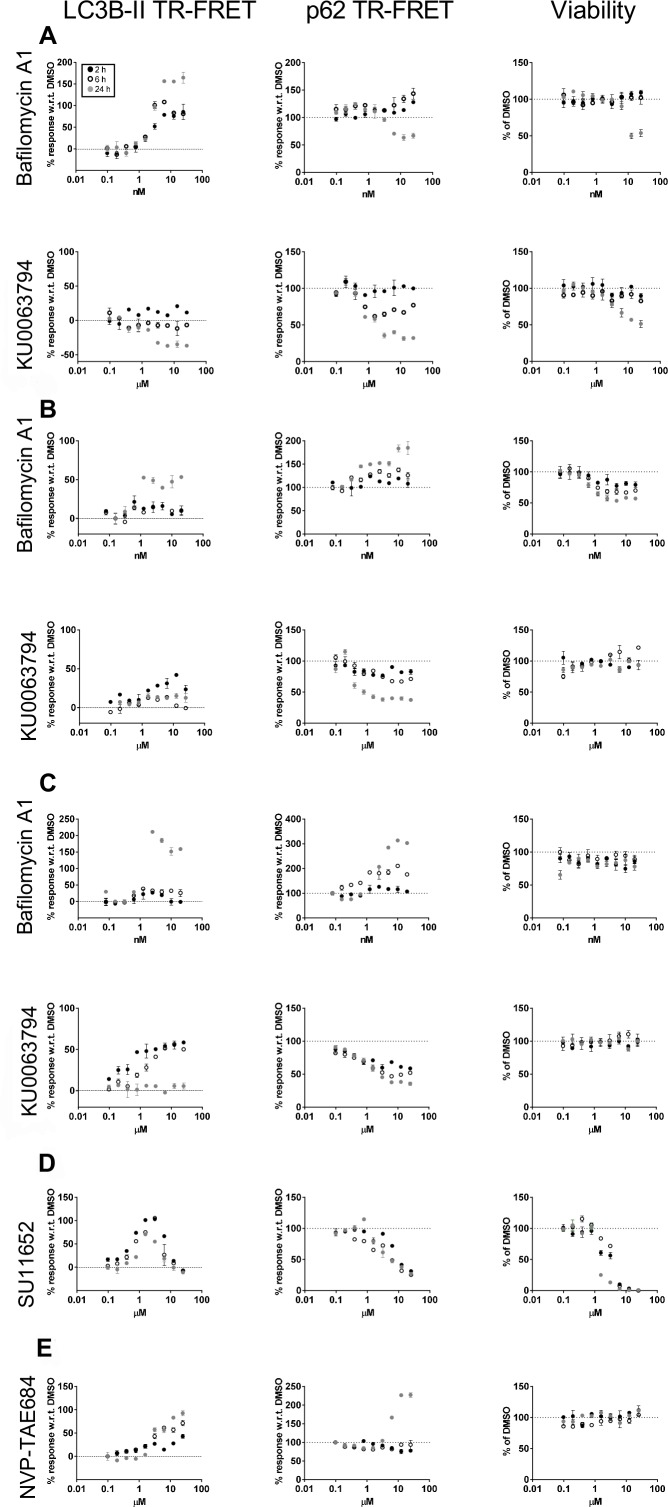
Fig 3. LC3B-II and p62 quantification in response to tool compounds treatment.
HEK293T cells (A), rat cortico-striatal neurons (B) and rat astrocytes (C) were treated with a serially diluted autophagy inhibitor (bafilomycin A1) or upregulator (KU0063794) and examined at 2, 6 and 24 hours post-treatment. LC3B-II and p62 were measured with TR-FRET (A-C). The response to compound treatment is reported as percentage average of three replicates with respect to vehicle (DMSO) treated samples (100%). Cell viability was evaluated by H33342 stained nuclei count for HEK293T (A) and astrocytes (C-E) and by neurite length/soma (morphometric readout) on MAP2 stained neurons (B). Astrocytes were also treated with SU11652 and NVP-TAE684 and LC3B-II, p62 and viability were measured with TR-FRET (D-E). Each data point is the mean±SEM (N = 3).

