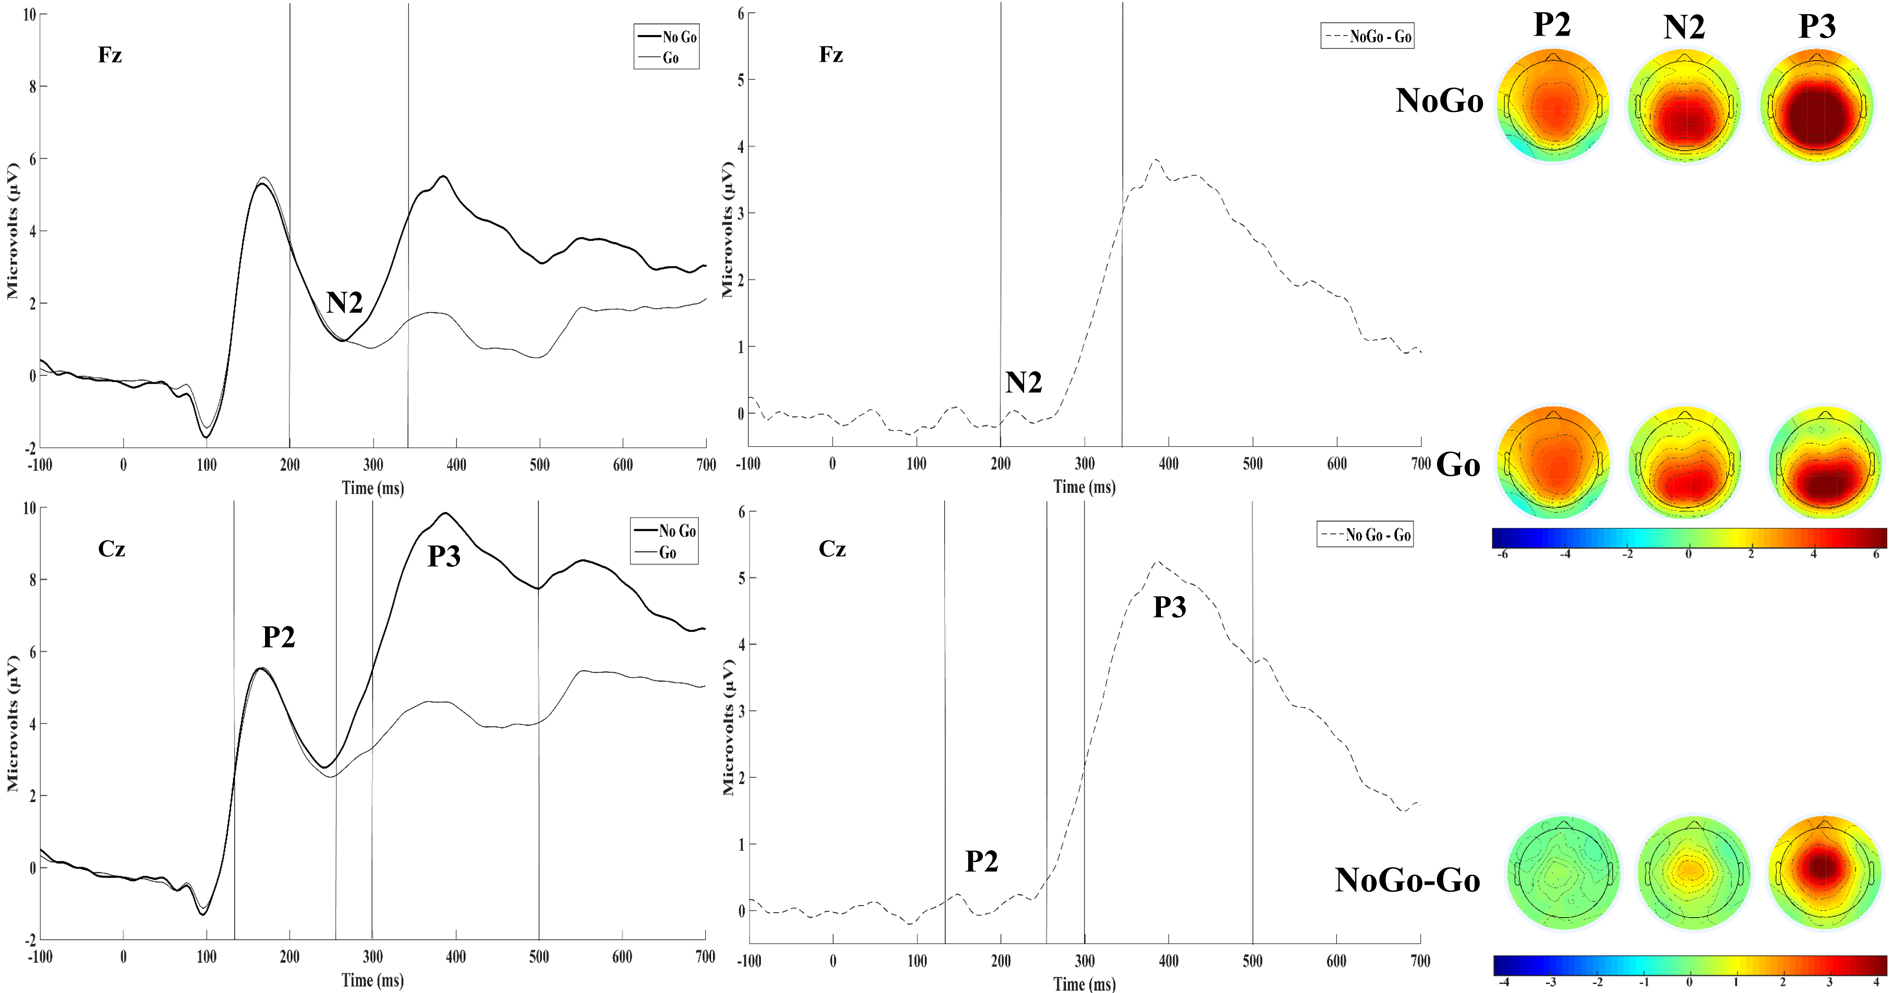
Figure 1.

Grand-averaged (N=256) No-go and Go ERPs are displayed adjacent to their corresponding difference waves at Fz and Cz. Topographical maps of the mean amplitude in the P2 (128–260ms), N2 (200–344ms), and P3 (296–500ms) time windows are displayed to the right. Time windows are demarcated with vertical lines to aid visualization.
