
Figure 3. Representative renderings of tau PET uptake in MAPT mutations relative to AD.
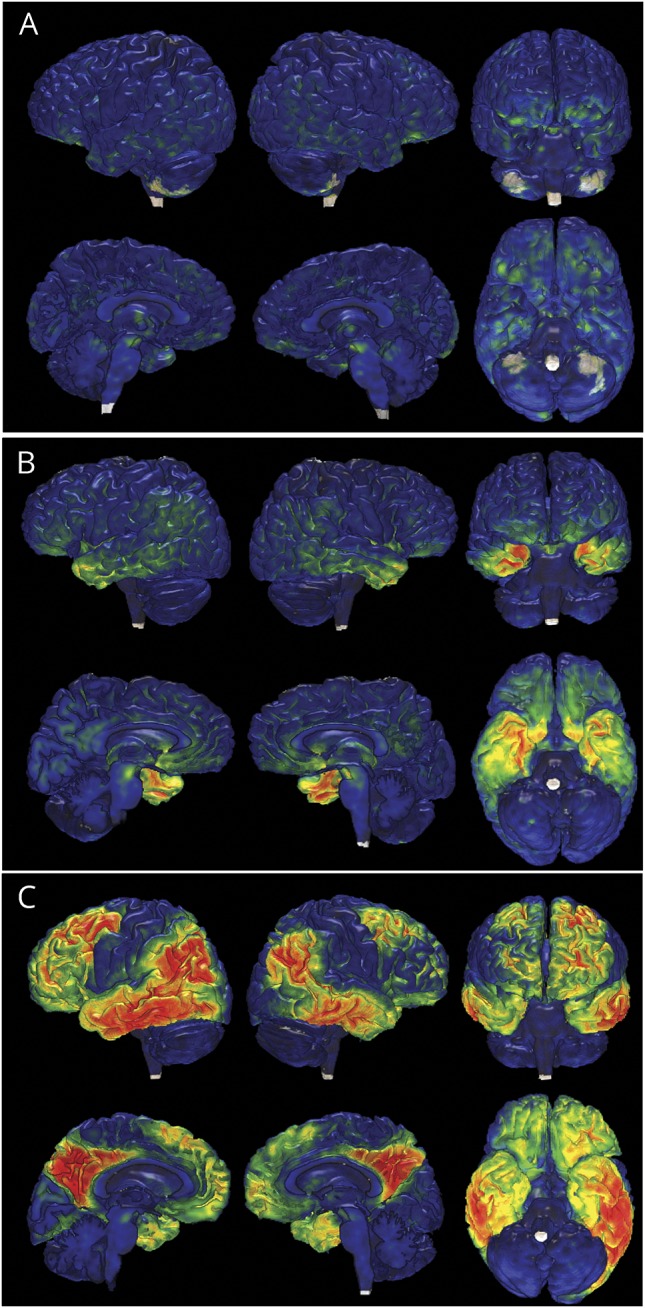
Tau PET global distributions are displayed on individual participant's brain renderings for 3 participants: (A) case 5, representative of participants with 4R MAPT with marginally elevated levels of tau PET signal; (B) case 11, representative of participants with mixed 3R/4R MAPT, and (C) a representative patient with AD dementia. The color maps contain the same dynamic range as figure 1. AD = Alzheimer disease; 4R = 4 repeat; MAPT = microtubule-associated protein tau gene; 3R = 3 repeat.