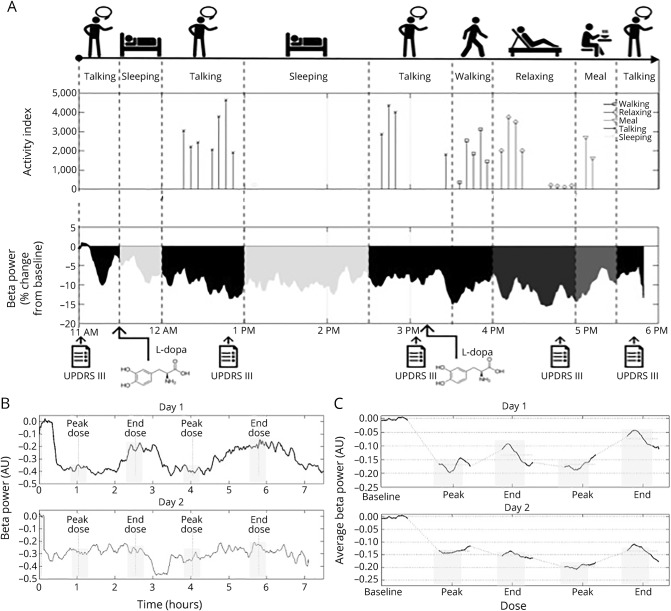
Figure 1. Experimental protocol and aDBS functioning.
(A) Top timeline shows the activities recorded during the 8 hours (10 am–6 pm) for a representative patient. Middle plot represents the activity index (i.e., a custom index based on accelerometer data in the band of 0.5–4 Hz representing the amount of motor activity) corresponding to each activity, and the bottom trace is beta power percentage change from baseline throughout the 8 hours. Bottom arrows show the times in which the patient was assessed (baseline, peak dose 1, end dose 1, peak dose 2, end dose 2) and received levodopa. (B) Beta power changes from baseline in day 1 (top trace) and day 2 (bottom trace) of a representative patient (patient 4). The x-axis represents time (hours) and y-axis represents percent beta power change from baseline. Gray rectangles highlight beta power during clinical assessments (baseline, peak dose 1, end dose 1, peak dose 2, end dose 2). (C) Average beta power changes from baseline in day 1 (top trace) and day 2 (bottom trace). Only the time windows of ±10 minutes around clinical assessments were represented to allow averaging among patients. The x-axis represents time (hours) and y-axis represents percent beta power change from baseline. Gray rectangles highlight beta power during clinical assessments (baseline, peak dose 1, end dose 1, peak dose 2, end dose 2). aDBS = adaptive deep brain stimulation; AU = arbitrary units; UPDRS = Unified Parkinson's Disease Rating Scale.

