Figure 7.
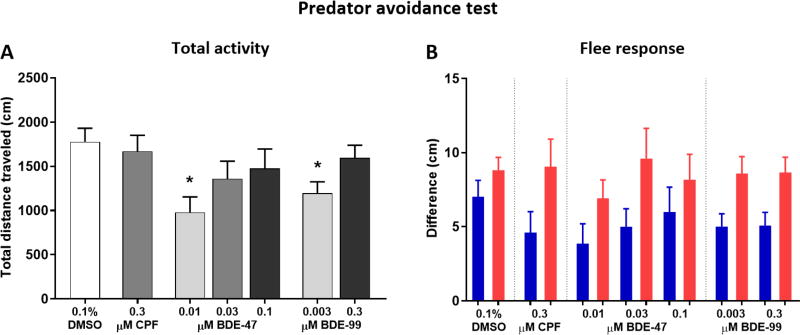
Predator avoidance test. Developmentally exposed adult zebrafish were individually placed in the testing tank (MUPET) and recorded for 9 minutes consisting of one min acclimation followed by alternating minute-long stimulus/no stimulus events. The stimulus was either a blue slow-growing dot or a red fast-growing dot appearing repeatedly on one of the screens. A) Total activity of the fish calculated as the total distance traveled throughout the trial. B) Flee response was calculated as the difference in average distance from the tank side between trial minutes in which the dot stimulus was presented and minutes in which there was no stimulus. Blue bars represent blue dot flee response and red bars represent red dot flee response.

