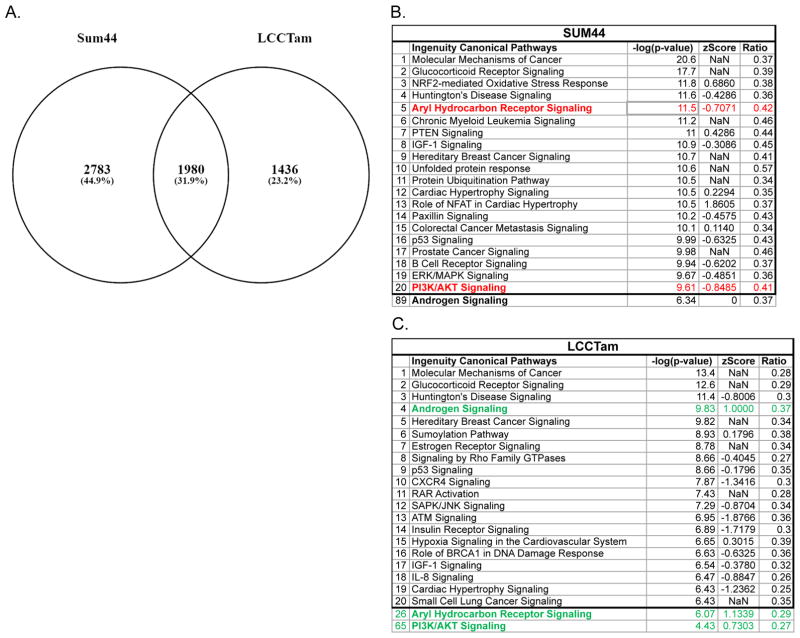
Figure 2.
Response to 4HT differs in SUM44 and LCCTam and suggests targetable pathways of TAM-resistance. A, SUM44 cells were treated with 500 nM 4HT for 24 hours and compared with controls while LCCTam maintained in 500 nM 4HT were compared with cells that were not treated with 4HT for 2 weeks. Affymetrix probe IDs for each comparison that had a fold change of ≥1.45 with a univariate p-value ≤0.05 were compared. B and C, Ingenuity Pathway Analysis (IPA) of Canonical Pathways for each cell line was completed and the top 20 affected pathways are shown; those discussed in the Results section are bolded. Red denotes pathways predicted to be downregulated in response to 4HT while green denotes upregulation.

