Figure 3.
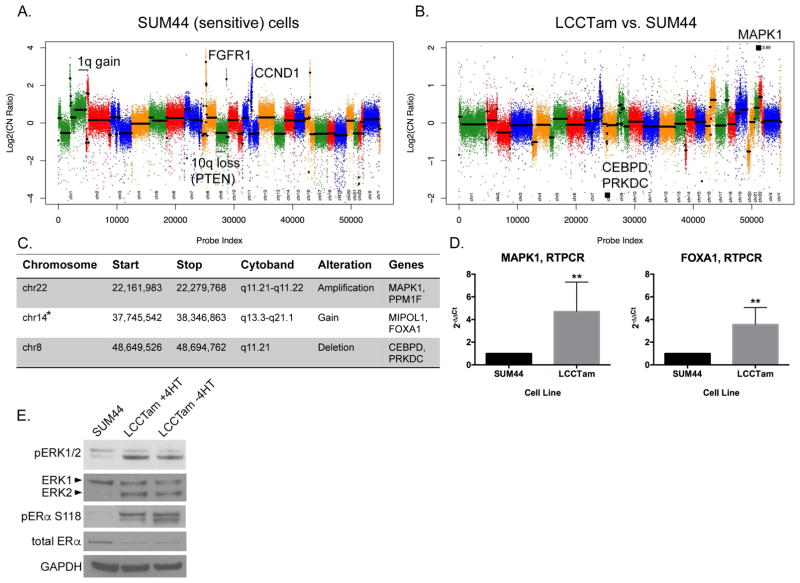
MAPK1 amplification and FOXA1 gain in TAM-resistant ILC cells. A, Copy number plot for parental SUM44 cell line. Log2 copy number (CN) ratios (Y axis) are shown as colored points and the circular binary segmentation (CBS)-generated segments are shown as black lines. Gains and losses characteristic of ILC are shown. B, Copy number alterations in LCCTam vs. SUM44 cells. Genes within largest amplification and deletion as determined by CBS are shown as black squares. C, Table of selected chromosome locations, cytobands, and genes showing significant amplification, gain, or deletion in LCCTam cells as determined by ADM-2. *denotes chromosome 14 gain identified only by ADM-2, whereas others were identified by both CBS and ADM-2. D, Quantitative real-time polymerase chain reaction (RTPCR) validation of increased MAPK1 and FOXA1 mRNA expression in LCCTam cells. Data are presented as relative expression calculated by the 2−ΔΔCt method and are the mean of 5 biological replicates ± standard deviation, with each biological replicate comprised of 3 technical replicates. Data were analyzed by Mann-Whitney U test. E, Western blot analysis of phosphorylated and total ERK1/2 (MAPK1 gene = ERK2 protein), phosphorylated and total ER, and GAPDH as a loading control. LCCTam −4HT cells were cultured in the absence of 4HT for 48 hours. Data shown are from a single representative experiment that was performed independently twice.

