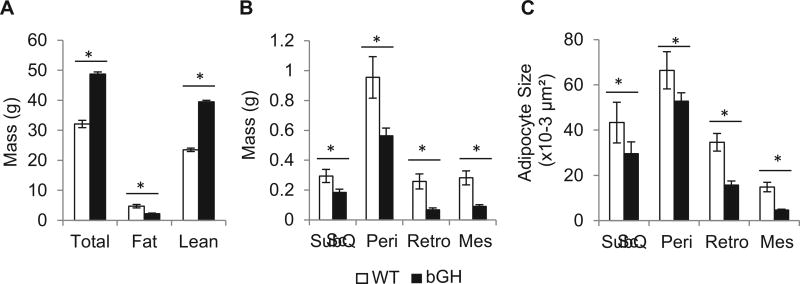
Fig. 1.
Comparison of A, body composition, B, individual adipose depot weight, and C, cell size of WT and bGH mice at 6 months of age (n=8 for both groups). In panel B, bGH tissue weights were significantly lower when analyzed by univariate analysis (F1,56 = 26.3, p = 3.7 × 10⁻⁶). In panel C, a two-way ANOVA found significant main for genotype (F1,302 = 130.7, p = 2.2 × 10⁻²⁵), depot (F3,302 = 79.2, p = 7.9 × 10−38), and the interaction of genotype and depot (F3,302 = 12.0, p = 2.0 × 10⁻⁷) on adipocyte size. All data are expressed as mean ± SEM of eight mice per group. Sc, subcutaneous; Peri, perigonadal; Retro, retroperitoneal; Mes, mesenteric. *, P < 0.05 versus WT using one way ANOVA with Student’s t test (panel A) or contrasts tests (B, C).

